

A comprehensive guide to R-squared, the coefficient of determination. Learn what R-squared means, how to calculate it, interpret its value, and use it to evaluate regression models. Includes formulas, intuitive explanations, practical guidelines, and visualizations.

This article is part of the free-to-read Machine Learning from Scratch
Choose your expertise level to adjust how many terms are explained. Beginners see more tooltips, experts see fewer to maintain reading flow. Hover over underlined terms for instant definitions.
R-squared: Measuring Model Fit
R-squared, also known as the coefficient of determination, is a key metric used to evaluate how well a regression model explains the variability of the dependent variable. This section provides an overview of R-squared, its formula, interpretation, and visual intuition.
Introduction
When building regression models, it's important to assess how well the model fits the data. R-squared quantifies the proportion of the variance in the dependent variable that is predictable from the independent variables.
The R-squared Formula
R-squared is defined as:
Where:
- : Residual sum of squares (unexplained variance)
- : Total sum of squares (total variance)
- : Actual value
- : Predicted value from the model
- : Mean of the actual values
Mathematical Intuition
The formula can be understood through variance decomposition. The total variance in the dependent variable can be split into explained variance (how much the model explains) and unexplained variance (how much remains). R-squared represents the proportion of total variance that is explained by the model. For simple linear regression, R-squared equals the square of the correlation coefficient between the predictor and response variables ().
Interpretation
- : The model explains all the variability of the response data around its mean (perfect fit).
- : The model explains none of the variability (no better than using the mean).
- : The model performs worse than simply using the mean as a predictor (rare but possible with poor models).
- Between 0 and 1: Indicates the proportion of variance explained by the model.
Example:
If , then 85% of the variance in the dependent variable is explained by the model.
Practical Guidelines
While R-squared interpretation depends on context, here are general guidelines: indicates excellent fit (though be cautious of overfitting), suggests good fit, shows moderate fit, and indicates poor fit. However, these are rough guidelines—in some domains like social sciences, might be considered good, while in others like physics, might be unacceptable.
Visualizing R-squared
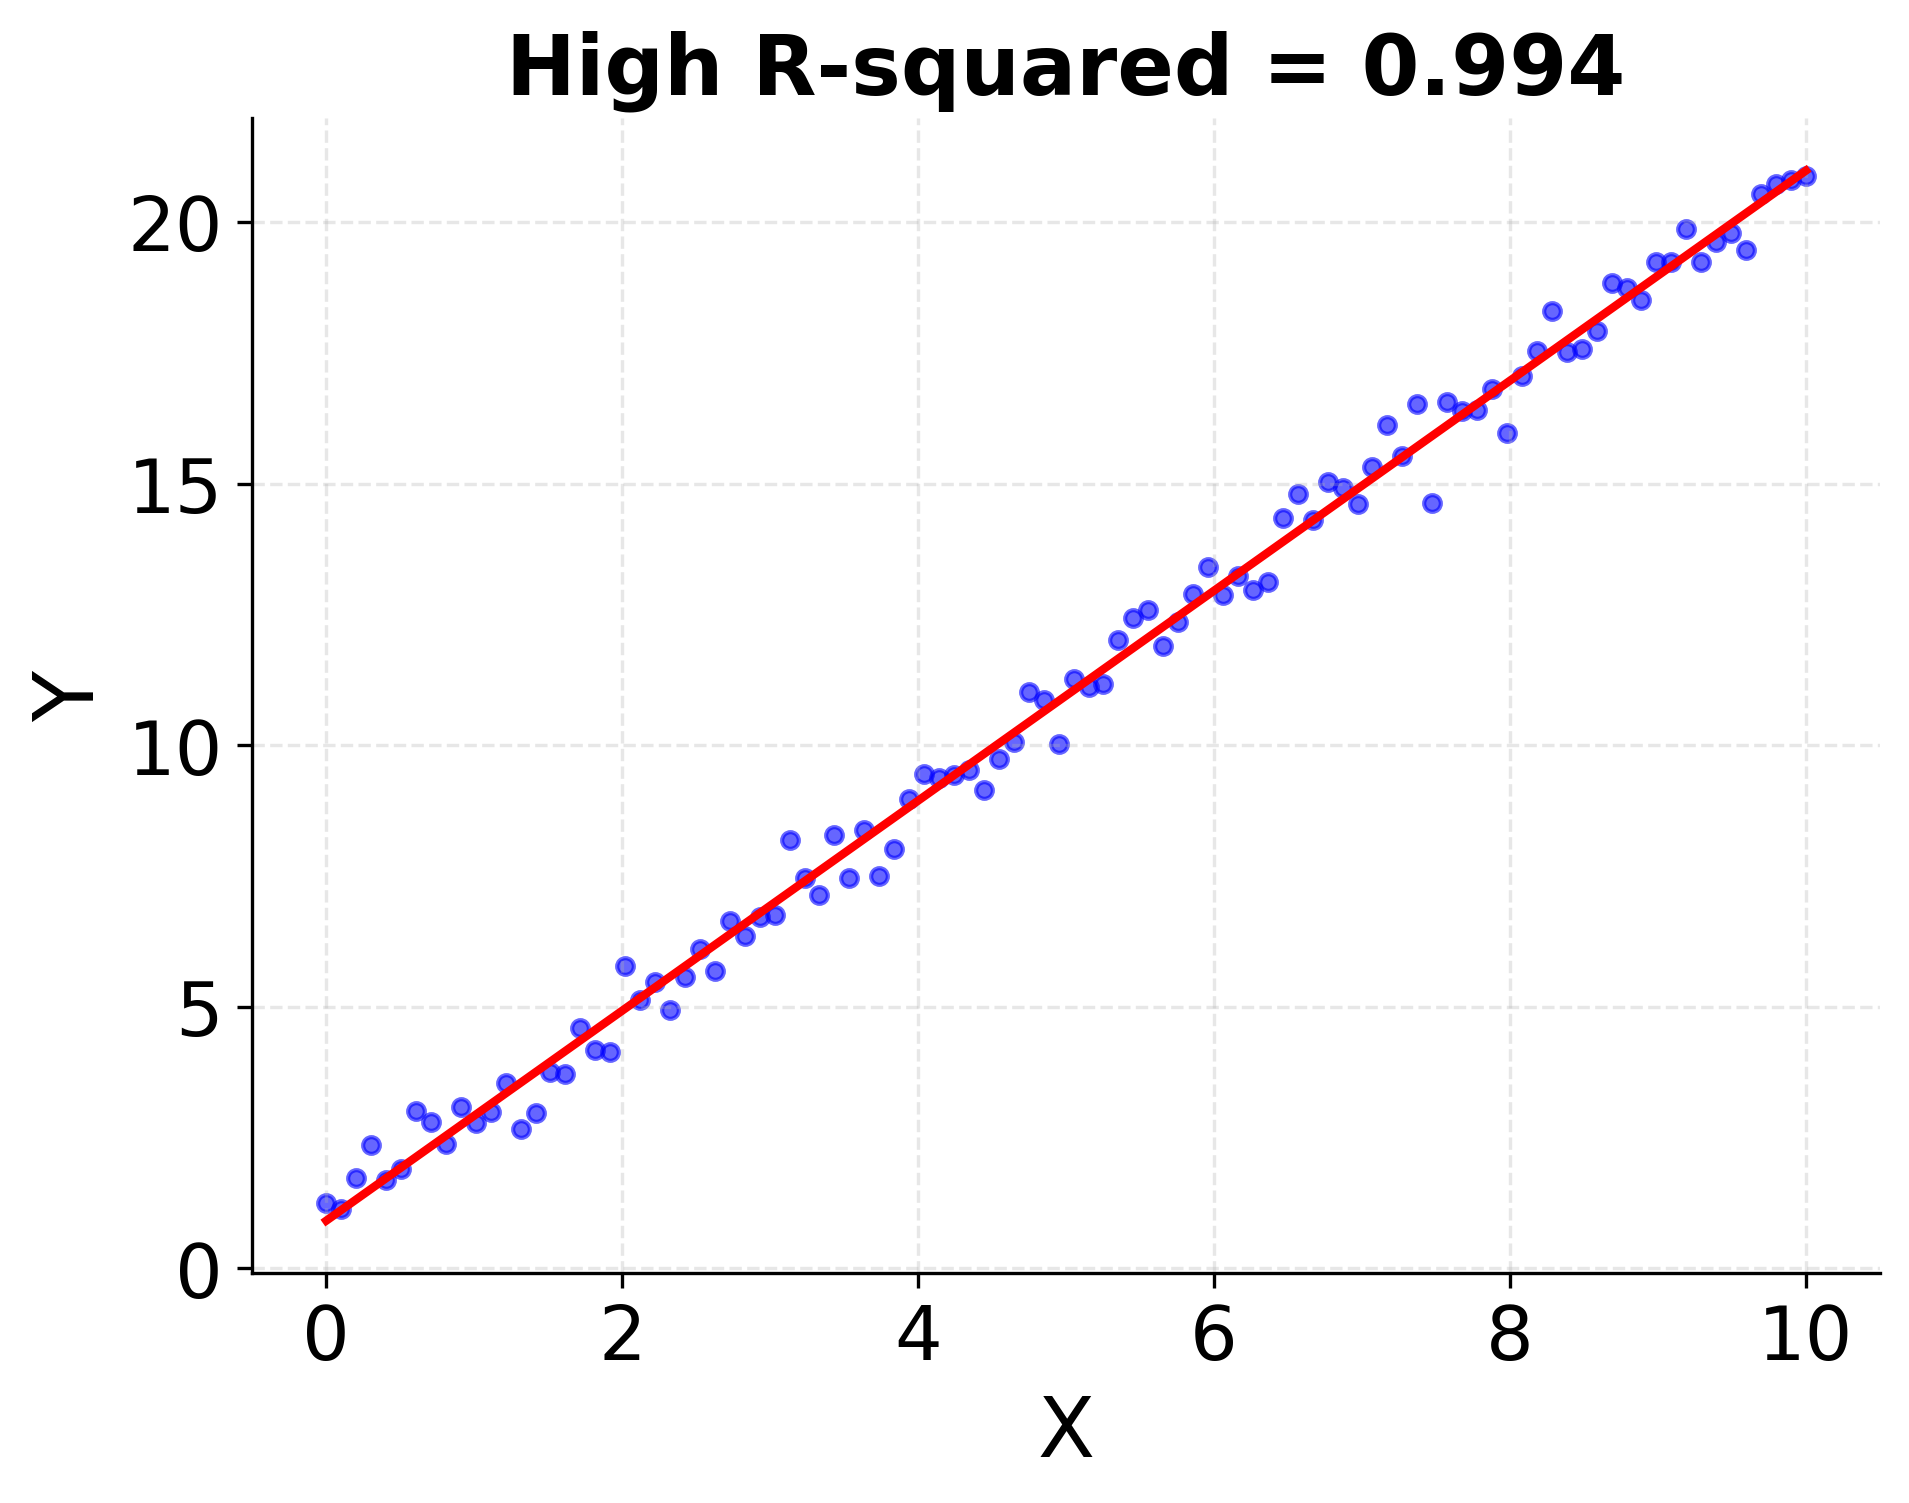
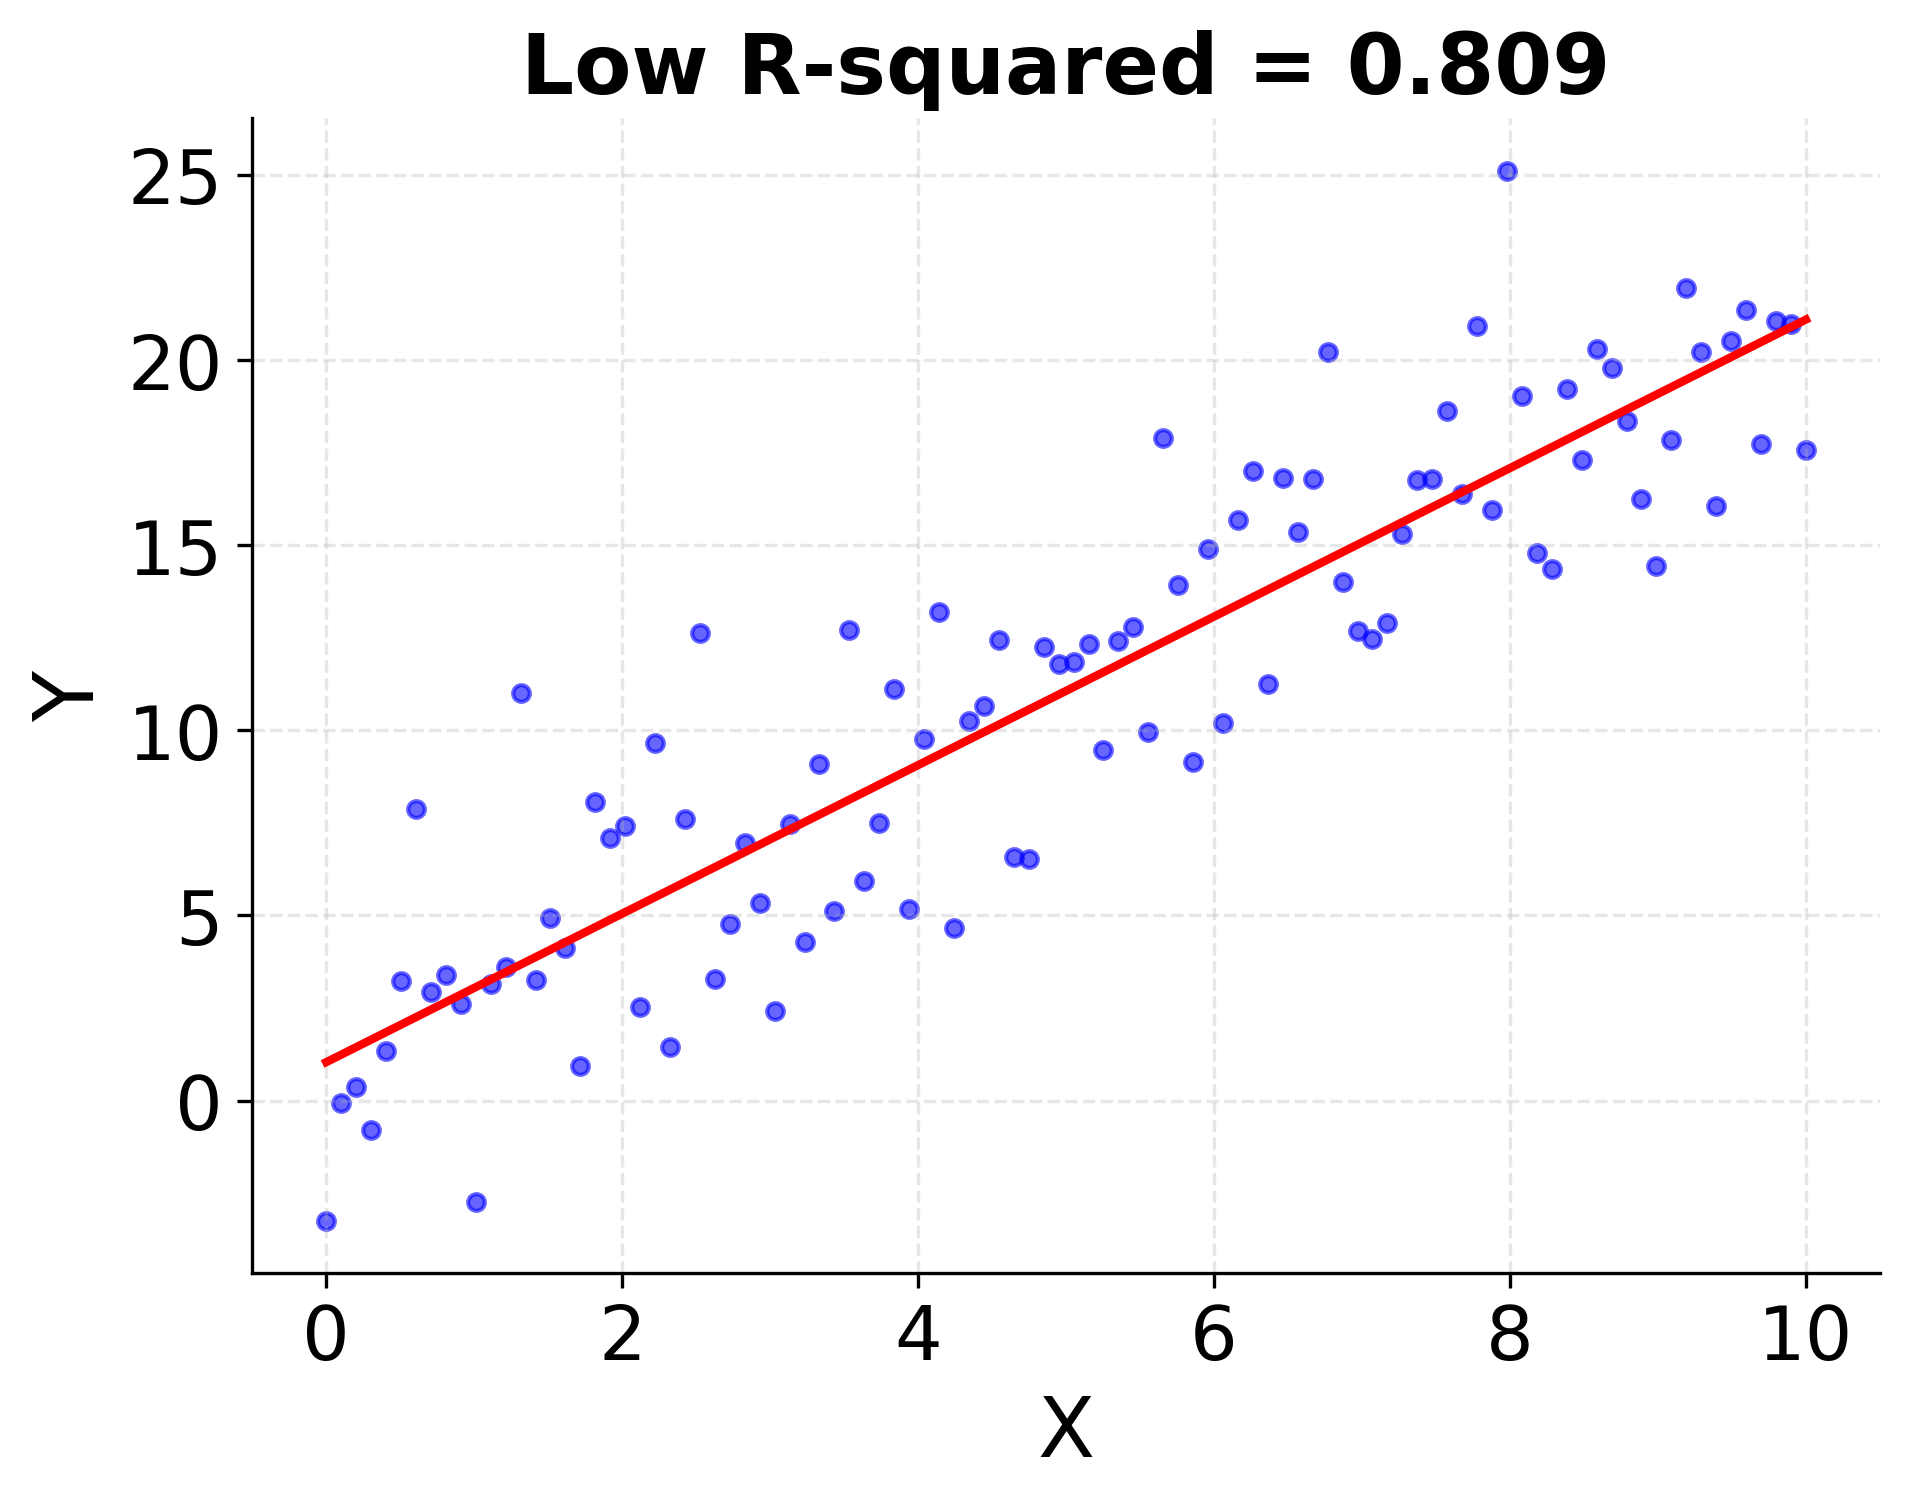
A higher R-squared means the regression line fits the data points more closely. Below is a conceptual illustration:
Plot 1: High vs. Low R-squared
- Left: Data points closely follow the regression line (high R-squared)
- Right: Data points are widely scattered around the line (low R-squared)
Adjusted R-squared
When dealing with multiple regression, the standard R-squared can be misleading because it always increases (or stays the same) when adding more predictors, even if those predictors don't improve the model. Adjusted R-squared accounts for the number of predictors using the formula , where is the number of observations and is the number of predictors. Unlike standard R-squared, adjusted R-squared can decrease when adding irrelevant predictors, providing a more honest assessment of model quality in multiple regression.
Comparison with Other Metrics
R-squared is just one of many regression evaluation metrics. While R-squared measures the proportion of variance explained, other metrics provide different insights: RMSE and MAE assess absolute prediction errors, AIC and BIC help with model selection, and cross-validation evaluates out-of-sample performance. R-squared is excellent for quick assessment of model fit and communicating results to non-technical audiences, but for understanding prediction errors, use RMSE or MAE; for model selection, use AIC or BIC; and for out-of-sample performance, use cross-validation.
Common Misconceptions
Several misconceptions about R-squared are widespread. First, higher R-squared isn't always better—a model with might be overfitted and perform poorly on new data. Second, R-squared doesn't indicate causation, only correlation. Third, R-squared of 0.3 isn't always bad—context matters, as social sciences might consider this excellent while physics would find it poor. Fourth, R-squared doesn't work for all model types—it's designed for linear regression, and logistic regression requires pseudo-R-squared measures.
When R-squared is Misleading
R-squared can be misleading in several scenarios. For nonlinear relationships, R-squared assumes linearity and might be low even when the model captures the true relationship well. Outliers can dramatically affect R-squared, making it unreliable for overall model performance. When variance changes across the prediction range (heteroscedasticity), R-squared might not reflect true model quality. Overfitting can make R-squared artificially high when the model has too many parameters relative to observations. Finally, with very small sample sizes, R-squared can be unstable and misleading.
Limitations
- R-squared does not indicate whether a regression model is appropriate.
- It can be artificially high for models with many predictors (use adjusted R-squared for multiple regression).
- A high R-squared does not imply causation.
- R-squared doesn't measure prediction accuracy on new data.
- It can be misleading with nonlinear relationships or outliers.
R-squared is a useful first check for model fit, but always consider it alongside other diagnostics and domain knowledge.
Summary
In summary, R-squared measures how well a regression model explains the variability of the dependent variable. It ranges from 0 to 1, with higher values indicating a better fit. However, R-squared alone does not guarantee that the model is appropriate or meaningful, so it should be interpreted in context and used alongside other evaluation metrics.

Comments