

Explore the architecture of quantitative trading systems. Learn to build robust data pipelines, strategy engines, risk controls, and execution infrastructure.
Choose your expertise level to adjust how many terms are explained. Beginners see more tooltips, experts see fewer to maintain reading flow. Hover over underlined terms for instant definitions.
Quant Trading Systems and Infrastructure
A quantitative trading strategy is only as good as the system that executes it. Throughout this book, we've developed sophisticated models for pricing derivatives, managing risk, and generating alpha through various trading strategies. However, transforming a promising backtest into a reliable production system requires robust infrastructure. This infrastructure must handle data ingestion, signal generation, risk monitoring, and order execution while maintaining the speed and reliability necessary for financial markets.
This chapter examines the architecture and components of professional quantitative trading systems. We'll explore how data flows from exchanges through your strategy engine to execution, the software and hardware considerations that determine whether you can compete in different market niches, and the critical safeguards that prevent catastrophic failures. Whether you're building a low-frequency systematic portfolio or a high-frequency market-making system, understanding these infrastructure principles is essential for translating quantitative research into profitable trading.
System Architecture Overview
A quantitative trading system comprises several interconnected components, each handling a specific function in the trading pipeline. Understanding how these pieces fit together provides a foundation for designing systems appropriate to your strategy's requirements. Before diving into the details of each component, it helps to visualize the overall structure and appreciate why this modular approach has become the industry standard.
The architecture of a trading system reflects decades of hard-won lessons about what works in production. Early trading systems were often monolithic, with data handling, strategy logic, risk management, and execution all intertwined in a single codebase. When these systems failed, diagnosing the problem was nearly impossible because responsibilities were unclear. When they needed upgrades, changes in one area could introduce bugs in seemingly unrelated functions. Modern architectures deliberately separate concerns, creating clear boundaries between components that communicate through well-defined interfaces.
The Trading Pipeline
At its core, a trading system follows a logical flow from data to decision to action. This flow can be understood as a pipeline where raw market information enters on one end, undergoes a series of transformations and validations, and ultimately results in orders sent to exchanges on the other end. Each stage of this pipeline serves a distinct purpose, and understanding these stages provides the conceptual framework for building reliable trading infrastructure.
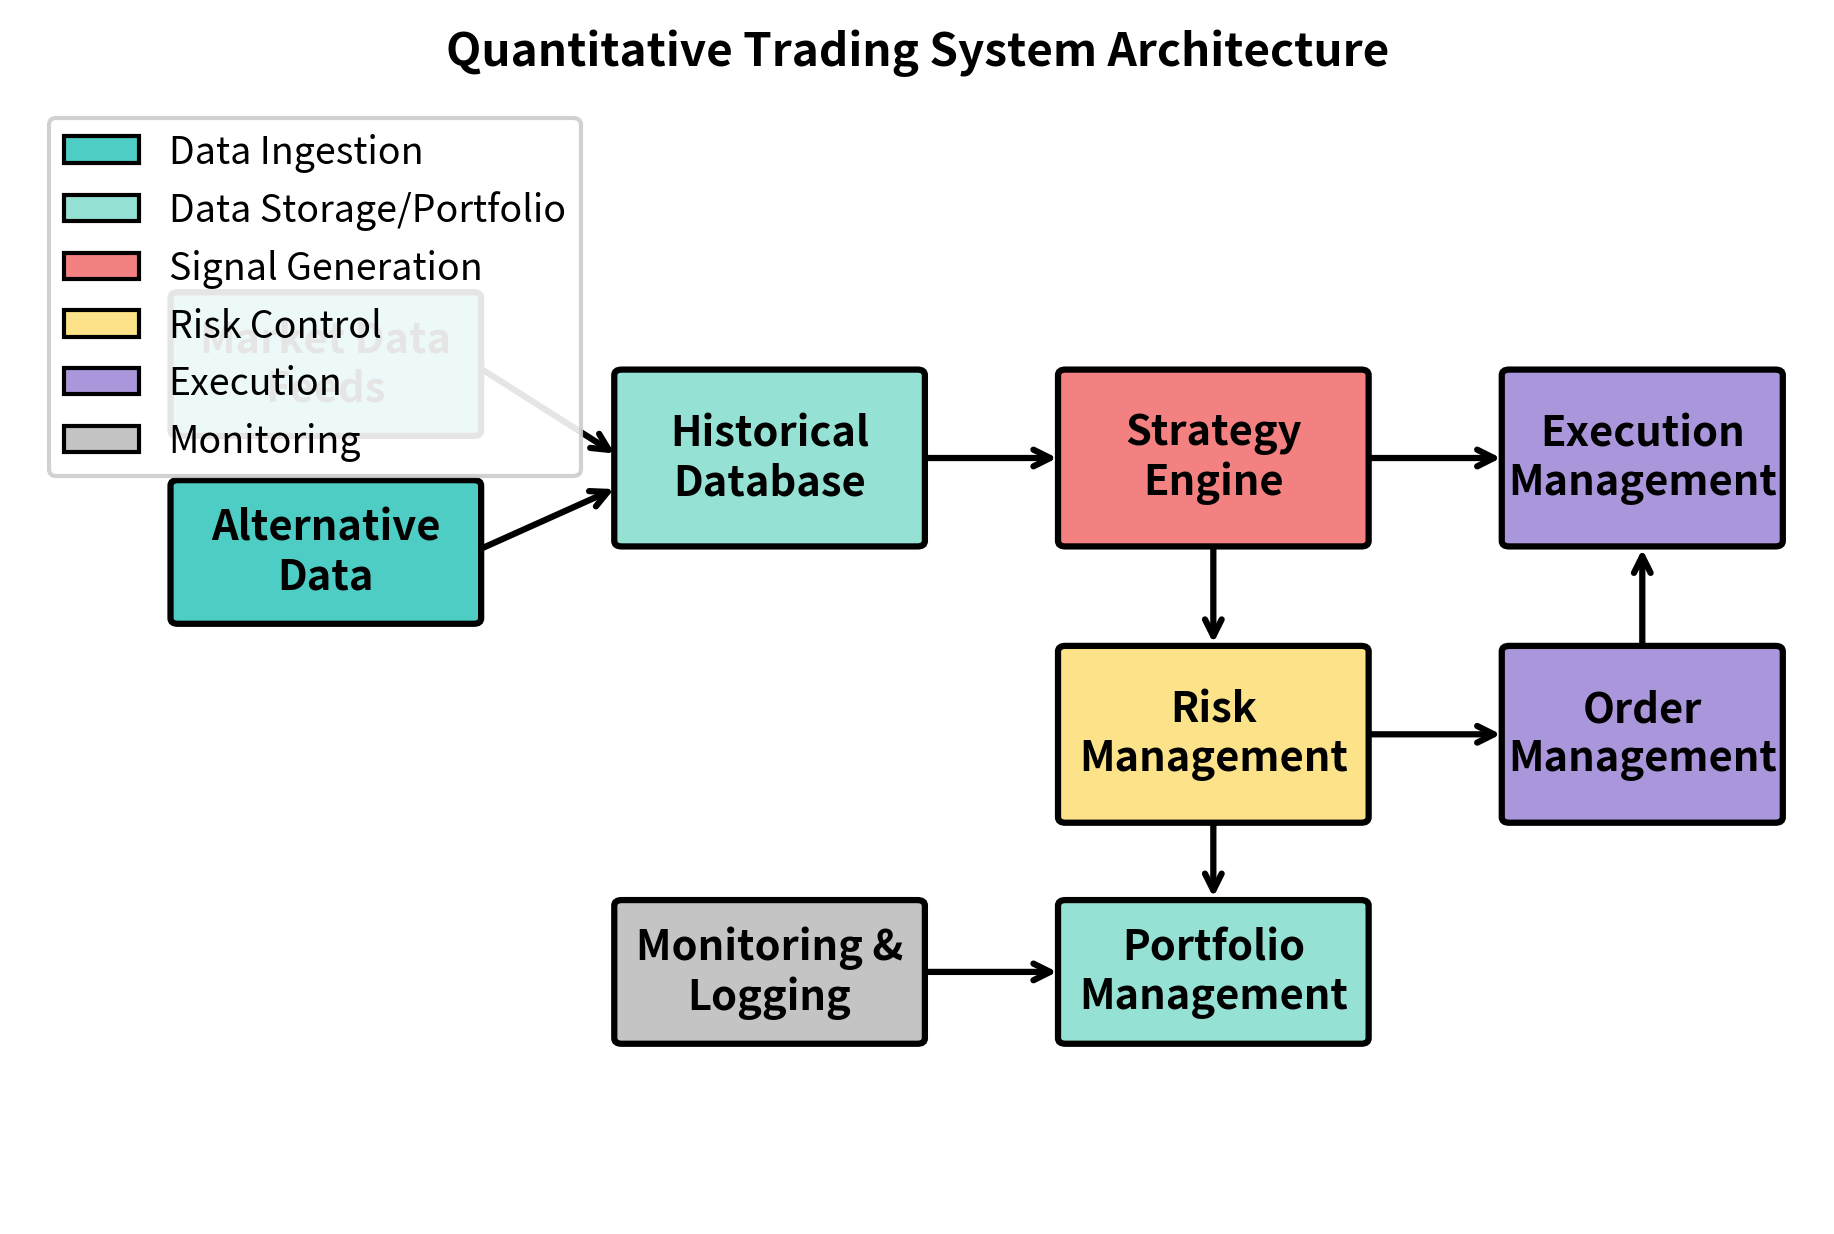
The key components that make up this architecture are:
- Data Infrastructure: Market data feeds, alternative data sources, and historical databases that provide the raw inputs for strategy decisions. This layer is responsible for capturing, validating, and storing the information that drives all downstream decisions.
- Strategy Engine: The core logic that transforms data into trading signals based on your quantitative models. This is where the alpha-generating ideas from your research become executable instructions.
- Risk Management System: Real-time monitoring of exposures, limits, and portfolio risk metrics. This component acts as a guardian, preventing the system from taking on unacceptable levels of risk.
- Execution Management System (EMS): Routes orders to exchanges and brokers, implementing the execution algorithms we covered in the previous chapter. The EMS translates abstract trading intentions into concrete market actions.
- Order Management System (OMS): Tracks order lifecycle, fills, and ensures compliance with trading limits. This system maintains the authoritative record of what orders have been sent, what has been filled, and what remains outstanding.
- Portfolio Management System: Maintains current positions, calculates P&L, and provides the state information needed for strategy decisions. Without accurate portfolio state, strategies cannot make informed decisions about what trades to execute.
- Monitoring and Logging: Records all system activity for debugging, compliance, and post-trade analysis. This often-overlooked component becomes invaluable when something goes wrong and you need to understand what happened.
Design Principles
Several principles guide the design of robust trading systems. These principles have emerged from countless production failures and represent collective wisdom about what makes systems reliable under the adversarial conditions of financial markets.
Separation of concerns keeps components modular and independently testable. Your strategy engine shouldn't know how orders are routed; your execution system shouldn't care what signal generated the order. This separation allows you to update components without cascading changes throughout the system. When a bug occurs in order routing, you can diagnose it without wading through strategy code. When you want to add a new execution venue, you don't need to modify your risk management logic.
Determinism and reproducibility ensure that given the same inputs, your system produces the same outputs. This is essential for debugging issues and validating that production behavior matches backtests. Random number generators should be seedable, and all external dependencies should be logged. When a production system behaves unexpectedly, you need the ability to replay the exact sequence of events that led to that behavior. Without determinism, debugging becomes nearly impossible.
Fail-safe defaults mean the system assumes the safest possible state when uncertainty exists. If a data feed drops, the system should not assume the last price is still valid. If risk calculations fail, trading should pause rather than continue blindly. This principle reflects a fundamental asymmetry in trading: the cost of missing a trading opportunity is usually far less than the cost of making a catastrophic error. Systems should be designed to err on the side of caution.
Data Infrastructure
Data is the lifeblood of quantitative trading. The quality, timeliness, and comprehensiveness of your data infrastructure often determine whether a strategy succeeds or fails in production. A strategy that appears profitable in research may fail in production simply because the production data differs subtly from the research data, or because data quality issues introduce noise that swamps the signal.
The fundamental challenge of data infrastructure is managing the tradeoff between speed, cost, and coverage. Low-latency feeds require significant capital, while comprehensive historical databases consume substantial storage and engineering resources. Firms must prioritize data sources based on specific strategy requirements.
Market Data Feeds
Market data arrives through various channels depending on speed requirements and cost constraints. Understanding these channels and their characteristics is essential for matching your data infrastructure to your strategy needs.
Direct exchange feeds provide the lowest latency access to order book updates and trades. Exchanges like NYSE, NASDAQ, and CME offer proprietary feeds (NYSE Integrated Feed, NASDAQ TotalView, CME Market Data Platform) that deliver updates in microseconds. These feeds typically require co-location (placing your servers in the exchange's data center) and significant infrastructure investment. The data arrives in exchange-specific binary formats that require custom parsing code, and the feeds themselves can generate millions of messages per second during active trading periods.
Consolidated feeds aggregate data from multiple exchanges. In the US, the Securities Information Processor (SIP) consolidates quotes and trades from all equity exchanges. While slower than direct feeds (typically tens of milliseconds), consolidated feeds are simpler to consume and sufficient for most systematic strategies. They provide a unified view of the national best bid and offer without requiring you to manage connections to each individual exchange.
Vendor feeds from providers like Bloomberg, Refinitiv, or Interactive Brokers offer convenient APIs but add latency. For end-of-day strategies or research, this latency is irrelevant. For intraday strategies with holding periods of minutes or longer, vendor feeds are often adequate. These vendors handle the complexity of exchange connectivity, data normalization, and symbol mapping, allowing you to focus on strategy development rather than data engineering.
The following code demonstrates a basic structure for handling incoming market data, including validation logic that protects against common data quality issues:
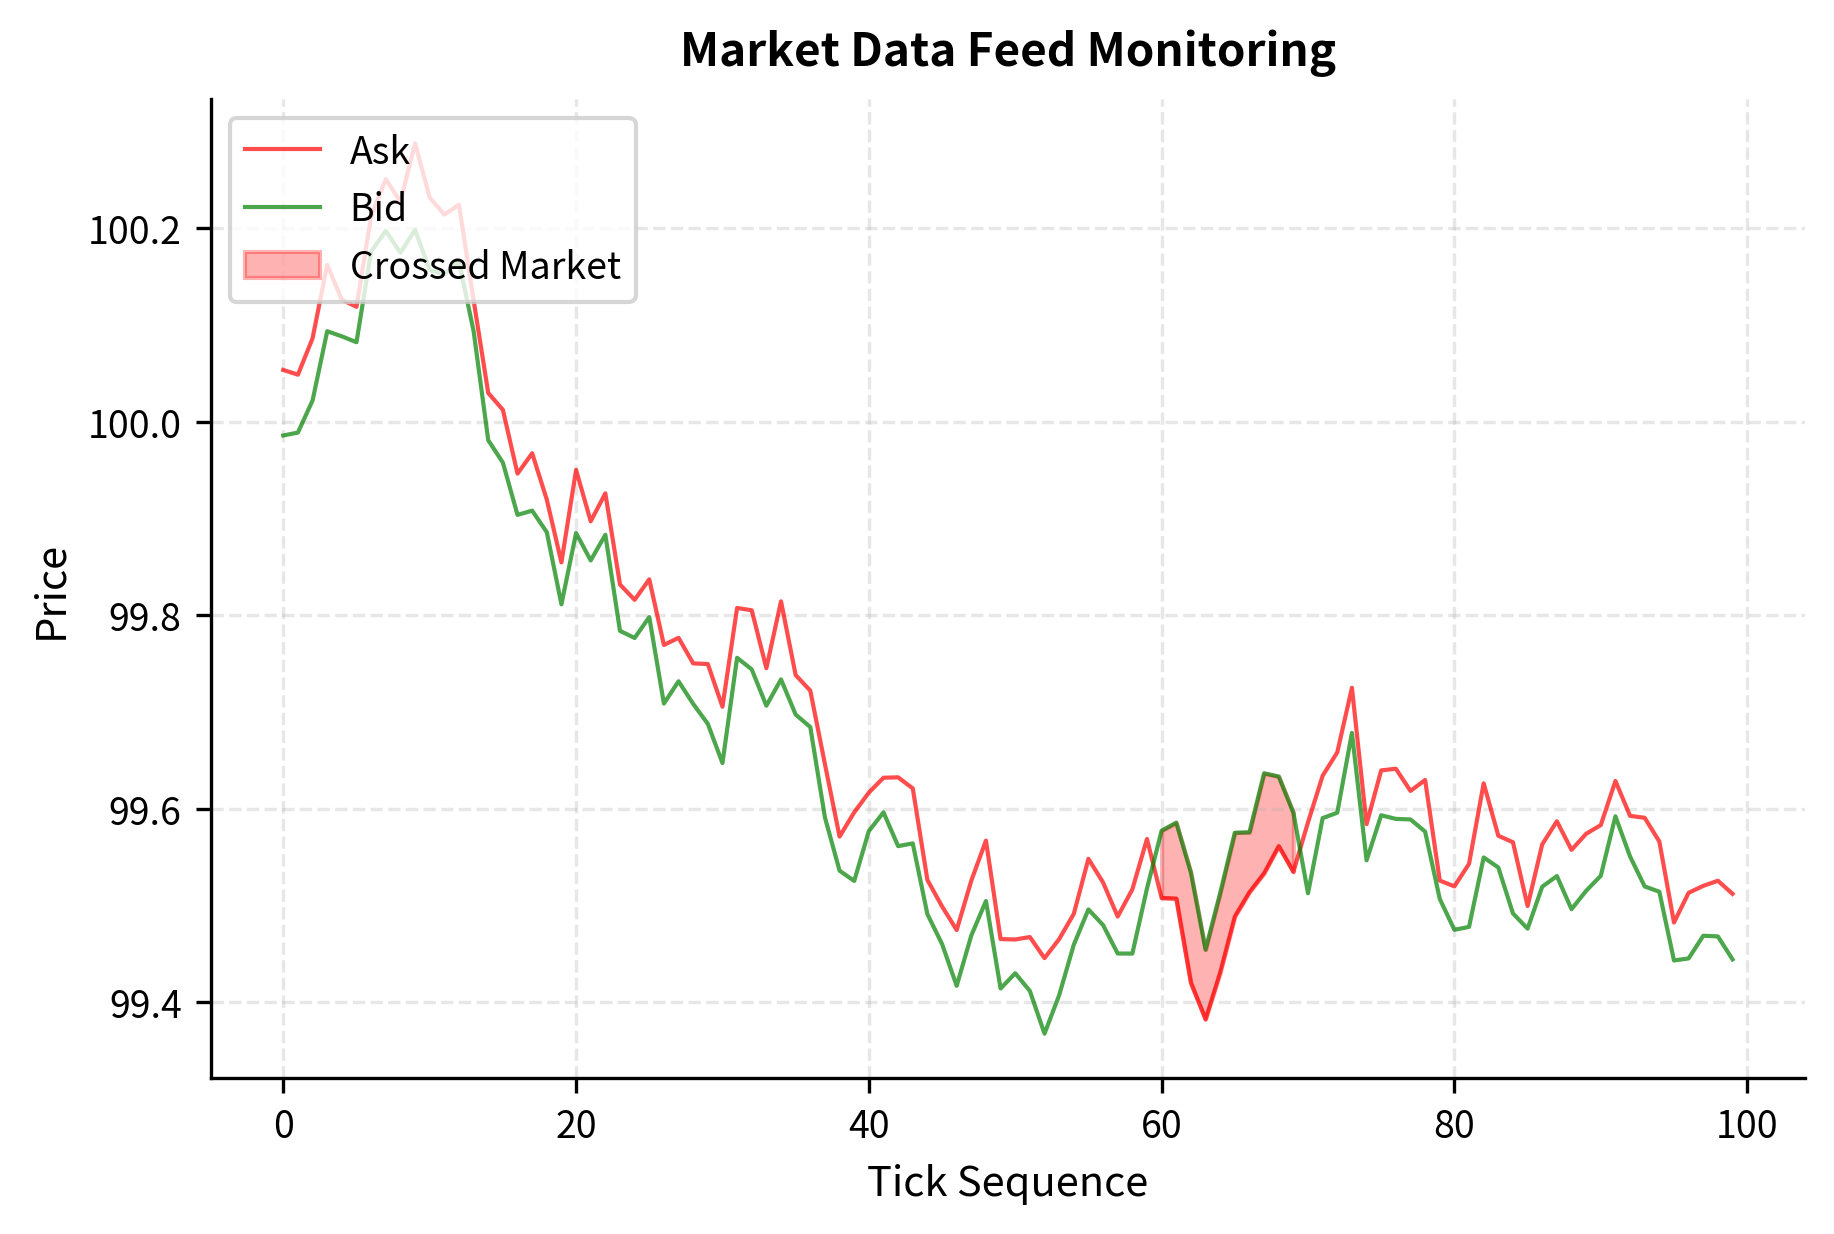
The validation logic catches the third tick where the bid price exceeds the ask price, a "crossed market" condition that indicates bad data. Production systems encounter such anomalies regularly and must handle them gracefully. Crossed markets can occur due to feed delays, exchange glitches, or data corruption during transmission. A system that blindly trusts such data might attempt to trade at impossible prices, leading to rejected orders or, worse, execution at unfavorable prices.
Alternative Data Integration
As we discussed in the Alternative Data chapter, non-traditional data sources can provide alpha. Integrating these feeds requires different infrastructure considerations than traditional market data. Alternative data often arrives less frequently, in unstructured formats, and with significant publication lags that must be carefully tracked.
Batch data like satellite imagery, credit card transactions, or SEC filings arrives periodically. This data flows through ETL (Extract, Transform, Load) pipelines that clean, normalize, and load it into your historical database. The key challenge is ensuring data is point-in-time correct. You must know exactly when information became available to avoid look-ahead bias. For example, a credit card transaction might occur on Monday, be aggregated by the data vendor on Wednesday, and become available to you on Thursday. Using that data to make trading decisions "as of Monday" in a backtest would introduce severe look-ahead bias.
Streaming data like social media sentiment or news feeds requires real-time processing. Natural language processing models extract signals from text, and these signals must align temporally with your market data. A tweet about a company might move its stock price within seconds; if your system processes that tweet minutes later, the trading opportunity has passed.
The following code illustrates the concept of point-in-time correctness, which is fundamental to both research integrity and production system design:
The point-in-time query correctly returns None before the earnings were released, preventing the look-ahead bias that would occur if we used the earnings surprise data before it was actually available. This seemingly simple distinction is one of the most common sources of error in quantitative research. Strategies that appear highly profitable in backtests often fail in production because they inadvertently used information that wasn't available at decision time.
Historical Data Storage
Historical data storage must balance several competing requirements: query speed for research and backtesting, storage efficiency for cost management, and data integrity for reproducibility. The choices you make here affect not just system performance but also the validity of your research conclusions.
Time-series databases like InfluxDB, TimescaleDB, or kdb+ are optimized for financial data. They support efficient time-range queries, downsampling, and compression. kdb+ in particular is ubiquitous in quantitative finance due to its exceptional performance with tick data, though it requires learning the q programming language. These specialized databases understand the temporal nature of financial data and can exploit that structure for dramatic performance improvements over general-purpose databases.
Data organization typically follows a hierarchy: asset class, then symbol, then date, then intraday data. Partitioning by date allows efficient pruning of historical queries and simplifies data retention policies. When you query for AAPL data from January 2024, the database can immediately skip all partitions except those containing January 2024 data, dramatically reducing the amount of data that must be scanned.
For tick-level data, storage requirements grow dramatically. A single liquid stock can generate millions of ticks per day, and storing order book snapshots multiplies this further. Compression and careful schema design become essential. Consider that storing full order book snapshots (all price levels with their sizes) at millisecond frequency for thousands of symbols would require petabytes of storage per year. Most firms make pragmatic decisions about what level of detail to store based on their research needs.
Strategy Engine Architecture
The strategy engine is where your quantitative models execute. It consumes data, calculates signals, and generates orders. The design of this component critically affects both performance and maintainability. A well-designed strategy engine makes it easy to test new ideas, debug production issues, and scale to more instruments or strategies.
The central challenge in strategy engine design is managing complexity. Strategies start simple but accumulate complexity over time as edge cases are discovered, market conditions change, and new features are added. Without careful architecture, this complexity can make strategies unmaintainable and bug-prone.
Event-Driven vs. Batch Processing
Strategies operate in two fundamental modes, and choosing the right mode depends on your strategy's time horizon and performance requirements.
Event-driven systems react to each market data update. When a new tick arrives, the system immediately recalculates relevant signals and potentially generates orders. This architecture is essential for high-frequency strategies where speed matters. Every microsecond of delay represents potential slippage or missed opportunities. Event-driven architectures require careful attention to processing efficiency, as the system must handle potentially millions of events per second during peak trading periods.
Batch processing runs at fixed intervals: every minute, every hour, or end-of-day. The system accumulates data, then processes it all at once. This approach is simpler, easier to debug, and sufficient for most systematic strategies with holding periods of days or longer. When you only trade once per day, there's no benefit to processing each tick in real-time. Batch processing allows you to use simpler, more readable code and focus engineering effort on strategy logic rather than low-level performance optimization.
The following code demonstrates a basic strategy framework that can operate in either mode. The abstraction captures the essential pattern: receive data, update state, generate signals, and calculate target positions.
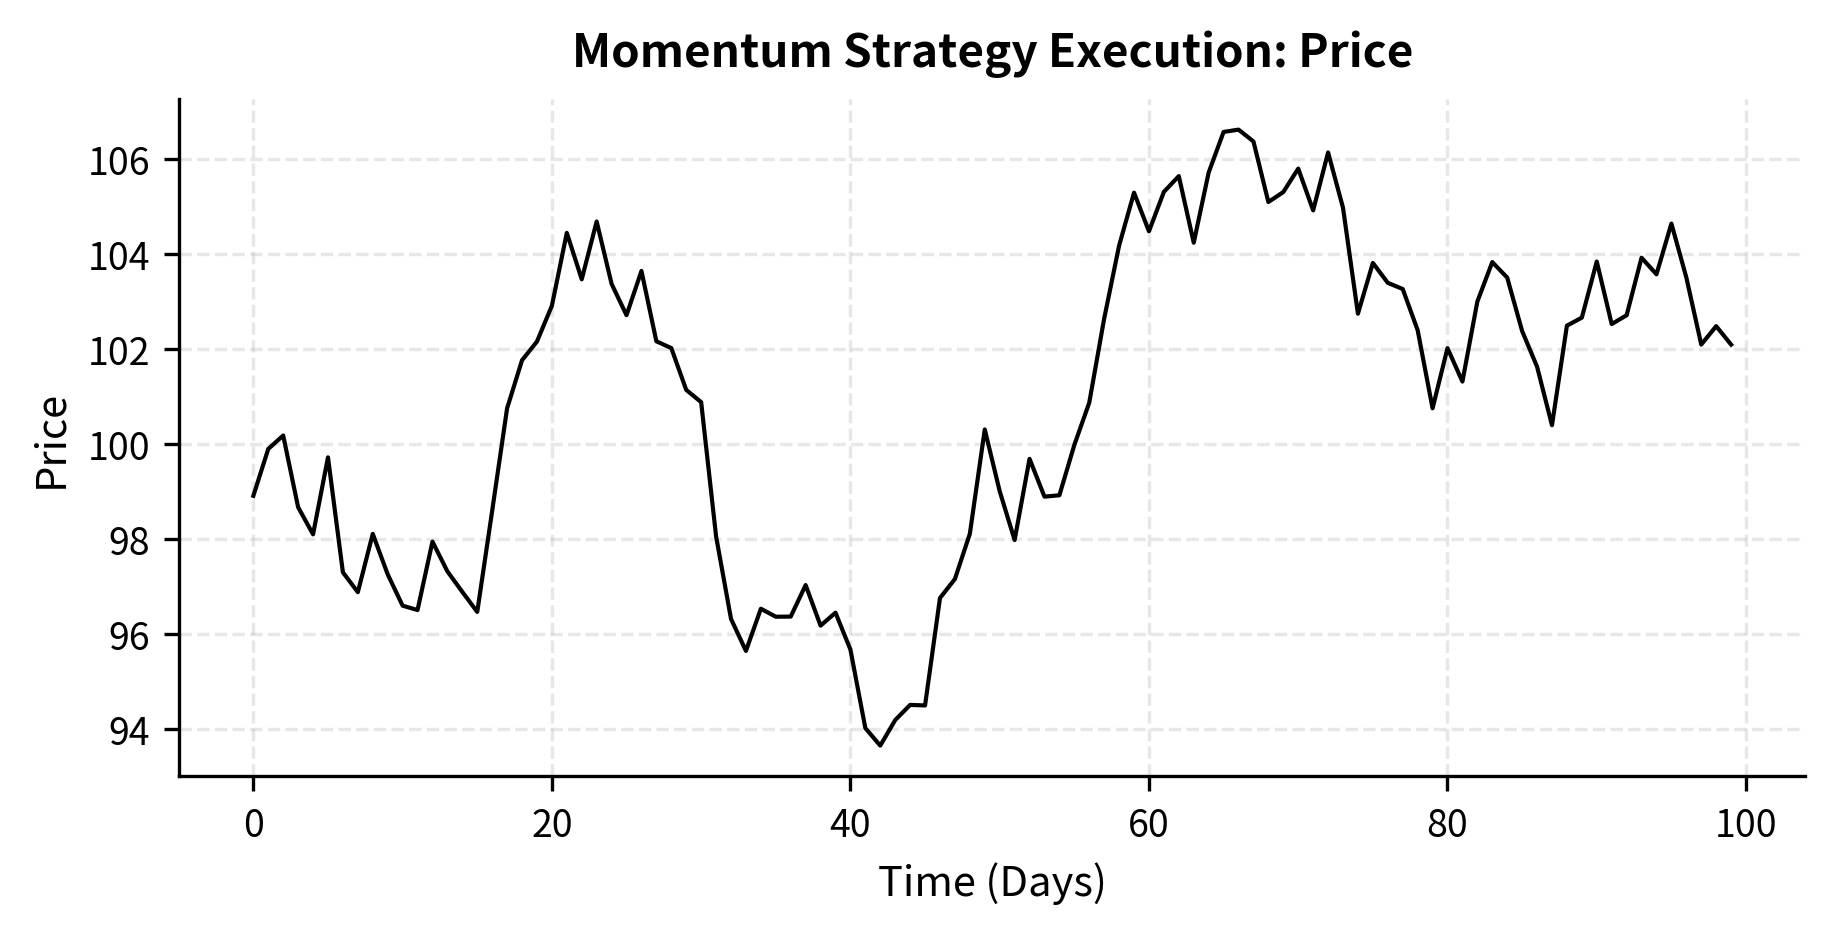
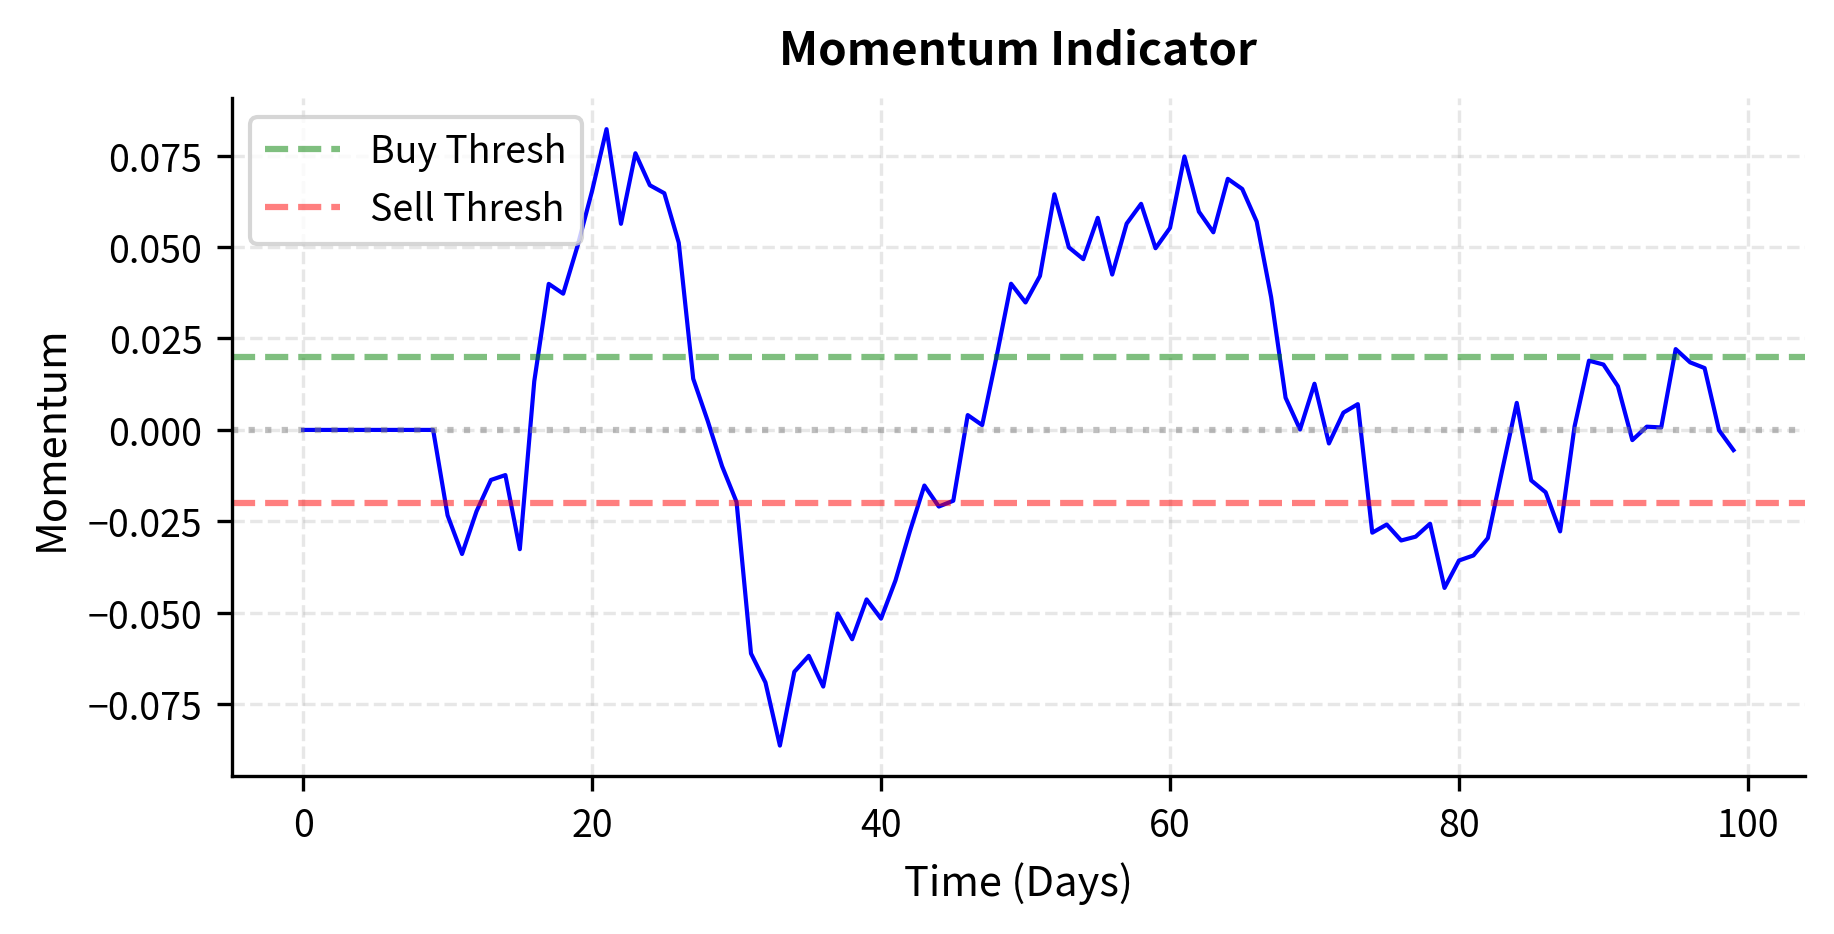
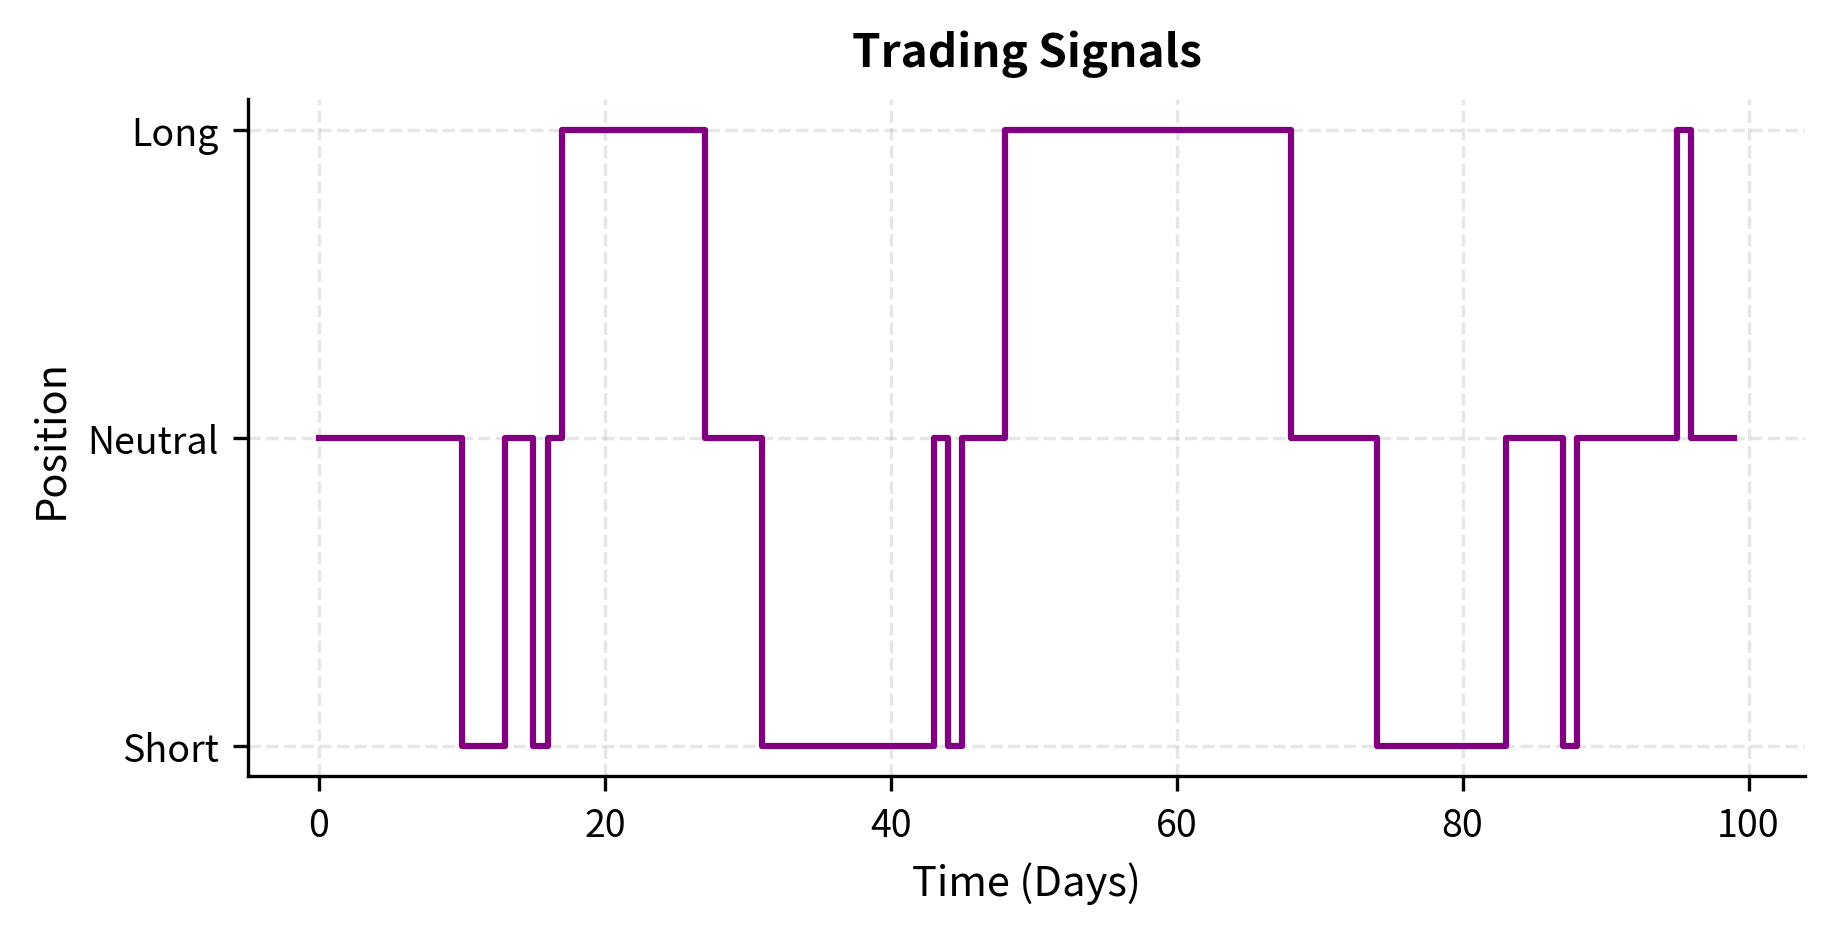
The strategy begins generating signals once it accumulates enough price history. Notice how signals change as momentum shifts, and target positions adjust accordingly. During the initial lookback period, all signals are NEUTRAL because the strategy doesn't have enough data to make a decision. This "warm-up" period is a common feature of strategies that depend on historical data.
Key Parameters
The key parameters for the Momentum strategy control the tradeoff between responsiveness and stability:
- lookback: The number of periods used to calculate price changes. A longer lookback filters noise but introduces lag. A 5-day lookback responds quickly to new trends but may generate false signals from short-term fluctuations. A 60-day lookback provides more reliable signals but may enter trends late and exit late.
- threshold: The minimum return required to generate a signal. Higher thresholds reduce trading frequency and transaction costs, but may miss smaller profitable moves. The optimal threshold depends on your transaction costs and the signal-to-noise ratio in your data.
State Management
Production strategies must maintain state correctly across restarts, market closes, and error conditions. State management is one of the most challenging aspects of production systems because it involves coordinating information across multiple components that may fail independently.
Key state includes:
- Current positions: Actual holdings, reconciled with broker records. Your internal position tracking must match what the broker believes you hold, or trades may fail or produce unexpected results.
- Open orders: Orders submitted but not yet filled or cancelled. If your system crashes and restarts, it must know about any orders that were submitted before the crash.
- Strategy state: Model parameters, accumulated signals, indicator values. A momentum strategy needs its price history; a mean-reversion strategy needs its running average.
- Risk state: Current exposures, drawdown levels, limit utilization. Risk limits apply continuously, not just at the moment an order is submitted.
State persistence ensures that if your system crashes at 2 PM, you can restart it without losing track of your positions or partially executed orders. Regular checkpointing provides an audit trail for post-trade analysis and compliance purposes. When regulators ask why a particular trade was executed, you need to be able to reconstruct the exact state that led to that decision.
Risk Management Systems
Real-time risk management is the guardian of your capital. As we covered extensively in Part V, risk comes in many forms: market risk, credit risk, liquidity risk. A production trading system must monitor and control all relevant risk dimensions continuously. The cost of inadequate risk management can be catastrophic, as numerous trading blow-ups have demonstrated.
Risk management in a trading system operates at multiple levels. Pre-trade checks validate individual orders before they're submitted. Real-time monitoring tracks aggregate portfolio risk continuously. Circuit breakers halt trading when anomalies are detected. Each layer provides defense against different types of failures.
Pre-Trade Risk Checks
Before any order is sent, the system should verify it doesn't violate risk limits. These checks serve as the last line of defense before capital is committed. They must be fast enough not to delay time-sensitive orders, yet thorough enough to catch dangerous trades.
The risk checker rejects the large order and the position-limit breaching order while approving the normal trade, preventing the system from taking excessive risk. Notice that each check is independent: an order might pass the size check but fail the concentration check, or pass all position checks but be rejected because the daily loss limit has already been breached.
Key Parameters
The key parameters for the Pre-Trade Risk Checker define the boundaries of acceptable risk:
- max_position_size Maximum notional value allowed for a single position. This limits concentration risk and ensures that no single position can cause catastrophic losses.
- max_order_size Maximum notional value allowed for a single order, preventing accidental large trades. A "fat finger" error that submits an order for 10,000 shares instead of 100 shares is caught by this limit.
- max_concentration Maximum percentage of portfolio value allowed in a single asset. Even if position size limits are respected, concentration limits ensure the portfolio remains diversified.
- max_daily_loss P&L threshold that triggers a suspension of trading. When losses accumulate beyond this level, the system stops trading to prevent further damage and allow human review.
Real-Time Portfolio Risk Monitoring
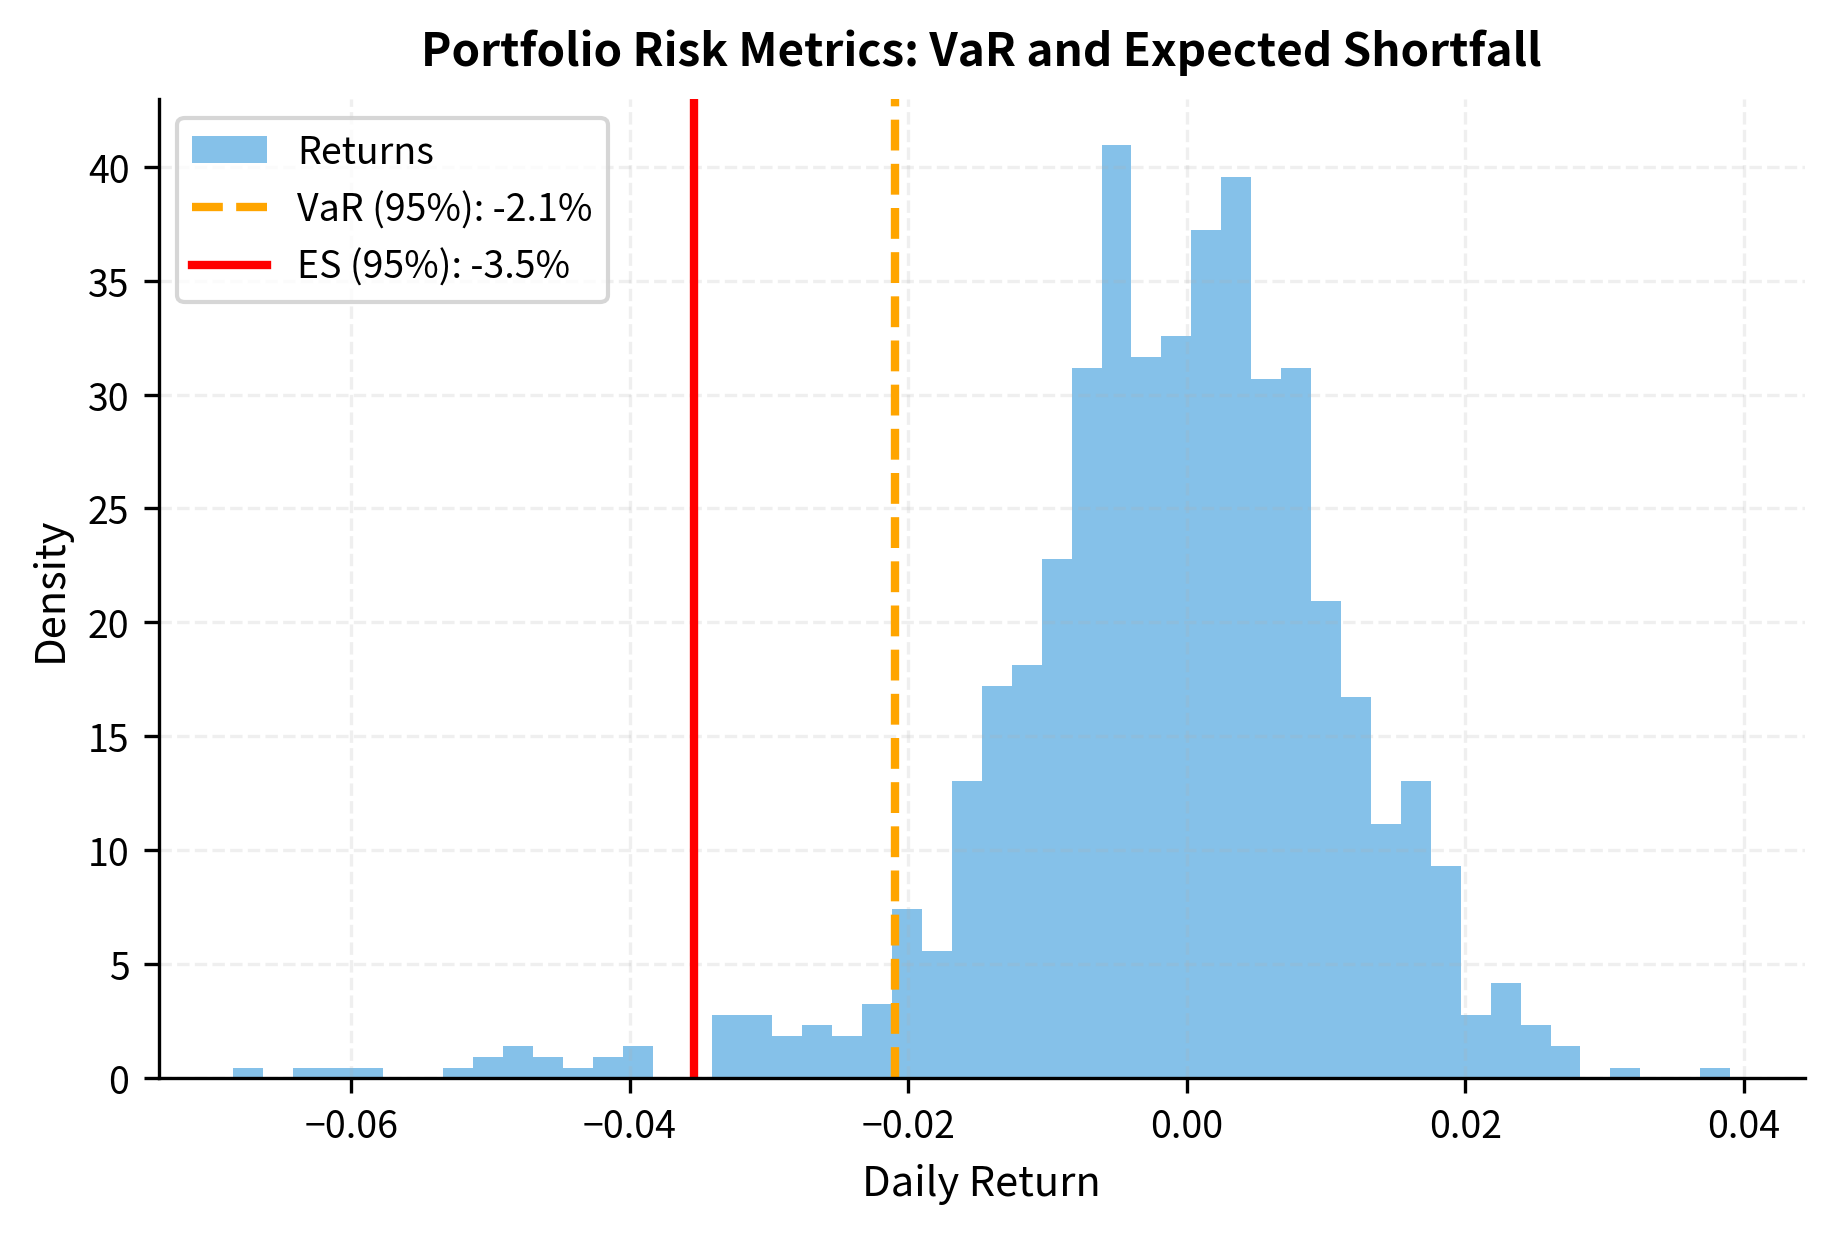
Beyond individual order checks, the system must continuously monitor aggregate portfolio risk. This includes calculating metrics we covered in Part V, such as Value at Risk and expected shortfall. These metrics provide a holistic view of portfolio risk that individual order checks cannot capture.
For example, a portfolio might consist entirely of positions that individually pass all risk checks, yet be dangerously exposed to a single risk factor. Real-time monitoring at the portfolio level catches these aggregate risks.
Execution Management System
The Execution Management System (EMS) turns trading decisions into executed orders. Building on the execution algorithms covered in the previous chapter, it manages order routing, protocol translation, and fill tracking, serving as the bridge between internal trading logic and external exchanges.
A well-designed EMS abstracts away the complexity of individual exchange protocols, allowing your strategy to work with a uniform interface regardless of which venues receive the orders. It also handles the many operational details that arise in real trading: partial fills, order modifications, exchange outages, and communication failures.
FIX Protocol Integration
The Financial Information eXchange (FIX) protocol is the industry standard for electronic trading communication. Understanding FIX is essential for anyone building trading infrastructure. FIX defines a standard message format for communicating orders, executions, and other trading-related information between counterparties.
The protocol uses a tag-value format where each field in a message is identified by a numeric tag. For example, tag 35 identifies the message type, tag 55 identifies the symbol, and tag 54 identifies the order side. This standardization allows systems from different vendors to communicate without custom integration for each pairing.
Production systems use FIX libraries like QuickFIX to handle the complexities of session management, message sequencing, and heartbeat monitoring. The message structure above is simplified, but illustrates the tag-value format that defines FIX communication. In the output above, tag 35 (MsgType) is 'D' for New Order Single, tag 54 (Side) is '1' for Buy, and tag 40 (OrdType) is '2' for Limit. Understanding these conventions is essential for debugging order routing issues and integrating with new execution venues.
Order Routing and Smart Order Routing
Smart Order Routing (SOR) determines the optimal destination for each order. In fragmented markets with multiple venues (NYSE, NASDAQ, BATS, IEX, dark pools), routing decisions significantly impact execution quality. The same order routed to different venues can result in meaningfully different execution prices and fill rates.
The challenge of smart order routing arises from market fragmentation. In the US equity market, the same stock can be traded on over a dozen different venues, each with different prices, liquidity, and fee structures. A naive approach of always routing to the exchange with the best displayed price ignores factors like queue position, fill probability, and maker-taker fee economics.
The best-price strategy fills at NASDAQ first (lowest ask at 185.49), while the minimize-impact strategy spreads the order proportionally across venues based on available liquidity. The best-price approach optimizes for immediate execution cost, while the minimize-impact approach reduces the information leakage that occurs when a large order sweeps all liquidity at a single venue.
Software and Hardware Considerations
The choice of programming languages and hardware depends critically on your strategy's latency requirements. Different components of the trading system have different performance needs, and understanding these differences allows you to allocate engineering resources effectively.
The fundamental insight is that most code in a trading system is not performance-critical. Data loading, configuration parsing, logging, and many other functions can be slow without affecting trading performance. The performance-critical path, from receiving market data to sending orders, is typically a small fraction of the codebase. Optimizing this critical path while using convenient, productive tools elsewhere is the hallmark of well-designed trading systems.
Language Selection by Component
Professional trading systems typically use multiple languages, each chosen for its strengths in particular roles:
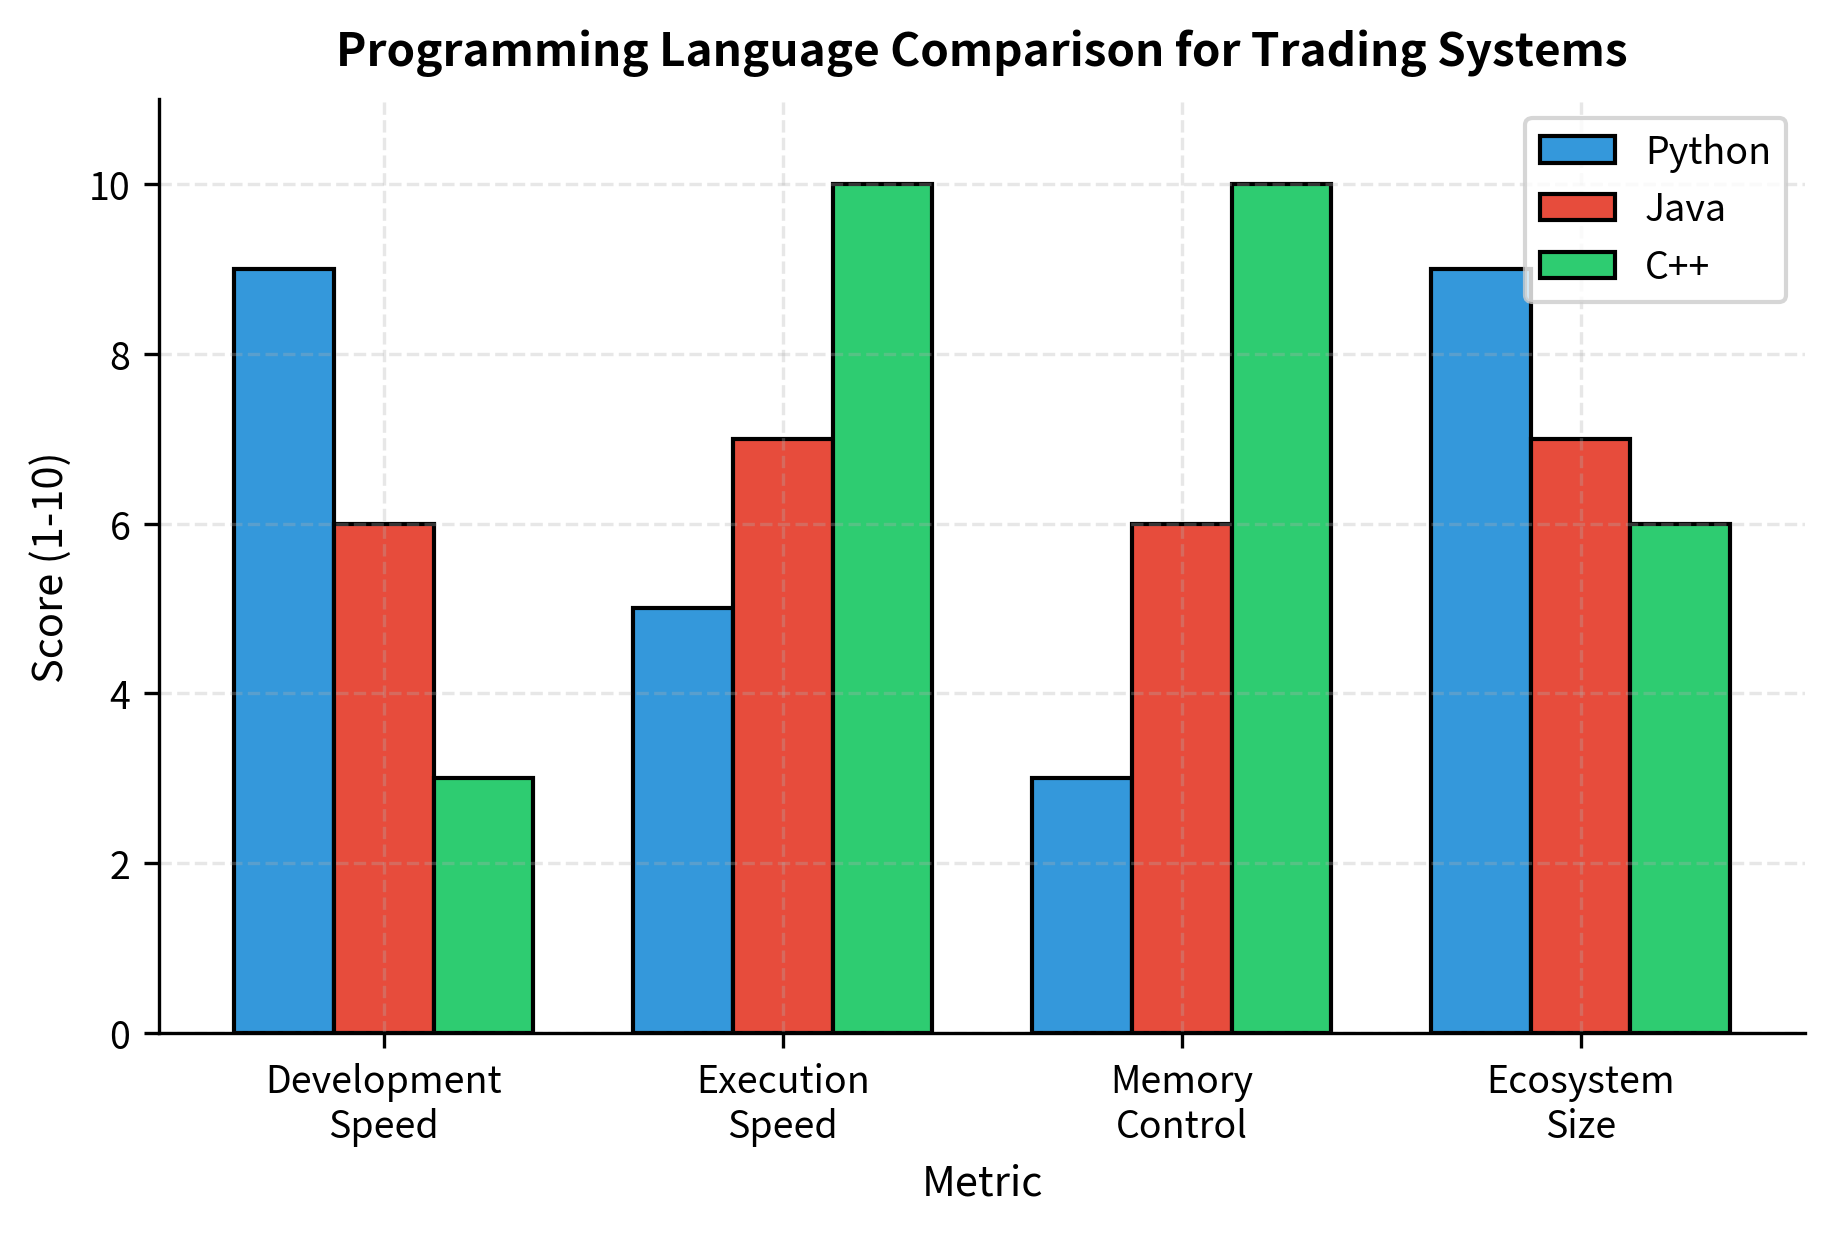
Python dominates research and strategy development due to its rich ecosystem (pandas, numpy, scikit-learn) and rapid prototyping capability. For strategies with holding periods of hours or longer, Python is often sufficient for production execution as well. The language's readability and extensive libraries make it ideal for the exploratory, iterative nature of strategy research. When a new idea can be tested in an afternoon rather than a week, you can explore more ideas and find better strategies.
C++ is the standard for latency-critical components. Order routing, market data processing, and execution engines at HFT firms are written in C++ (or increasingly, Rust) to achieve microsecond response times. C++ offers direct memory control, cache optimization, and deterministic performance. The language allows programmers to reason precisely about what the hardware is doing, which is essential when microseconds matter. However, C++ development is significantly slower than Python, so it's reserved for components where performance truly justifies the development cost.
Java sits between Python and C++, offering better performance than Python while maintaining memory safety and cross-platform compatibility. Many large banks and asset managers use Java for their trading infrastructure. Java's garbage collector can introduce latency spikes, but careful tuning can minimize these pauses. The language's mature ecosystem, strong typing, and extensive tooling make it attractive for large, long-lived codebases.
Latency Considerations
Latency, the time between receiving market data and having your order arrive at the exchange, determines viability for certain strategies. Understanding the components of latency helps you identify where optimization effort will yield the greatest benefit.
The components of latency include:
- Network latency: Time for data to travel over wires (speed of light in fiber imposes a floor of approximately 5 microseconds per kilometer)
- Processing latency: Time to process market data and make decisions
- Serialization latency: Time to encode orders into FIX or binary protocols
Each component can be optimized, but the costs and complexity increase dramatically as you push toward lower latencies. Network latency can be reduced by moving closer to the exchange. Processing latency can be reduced by using faster languages and more efficient algorithms. Serialization latency can be reduced by using binary protocols instead of text-based formats like FIX.
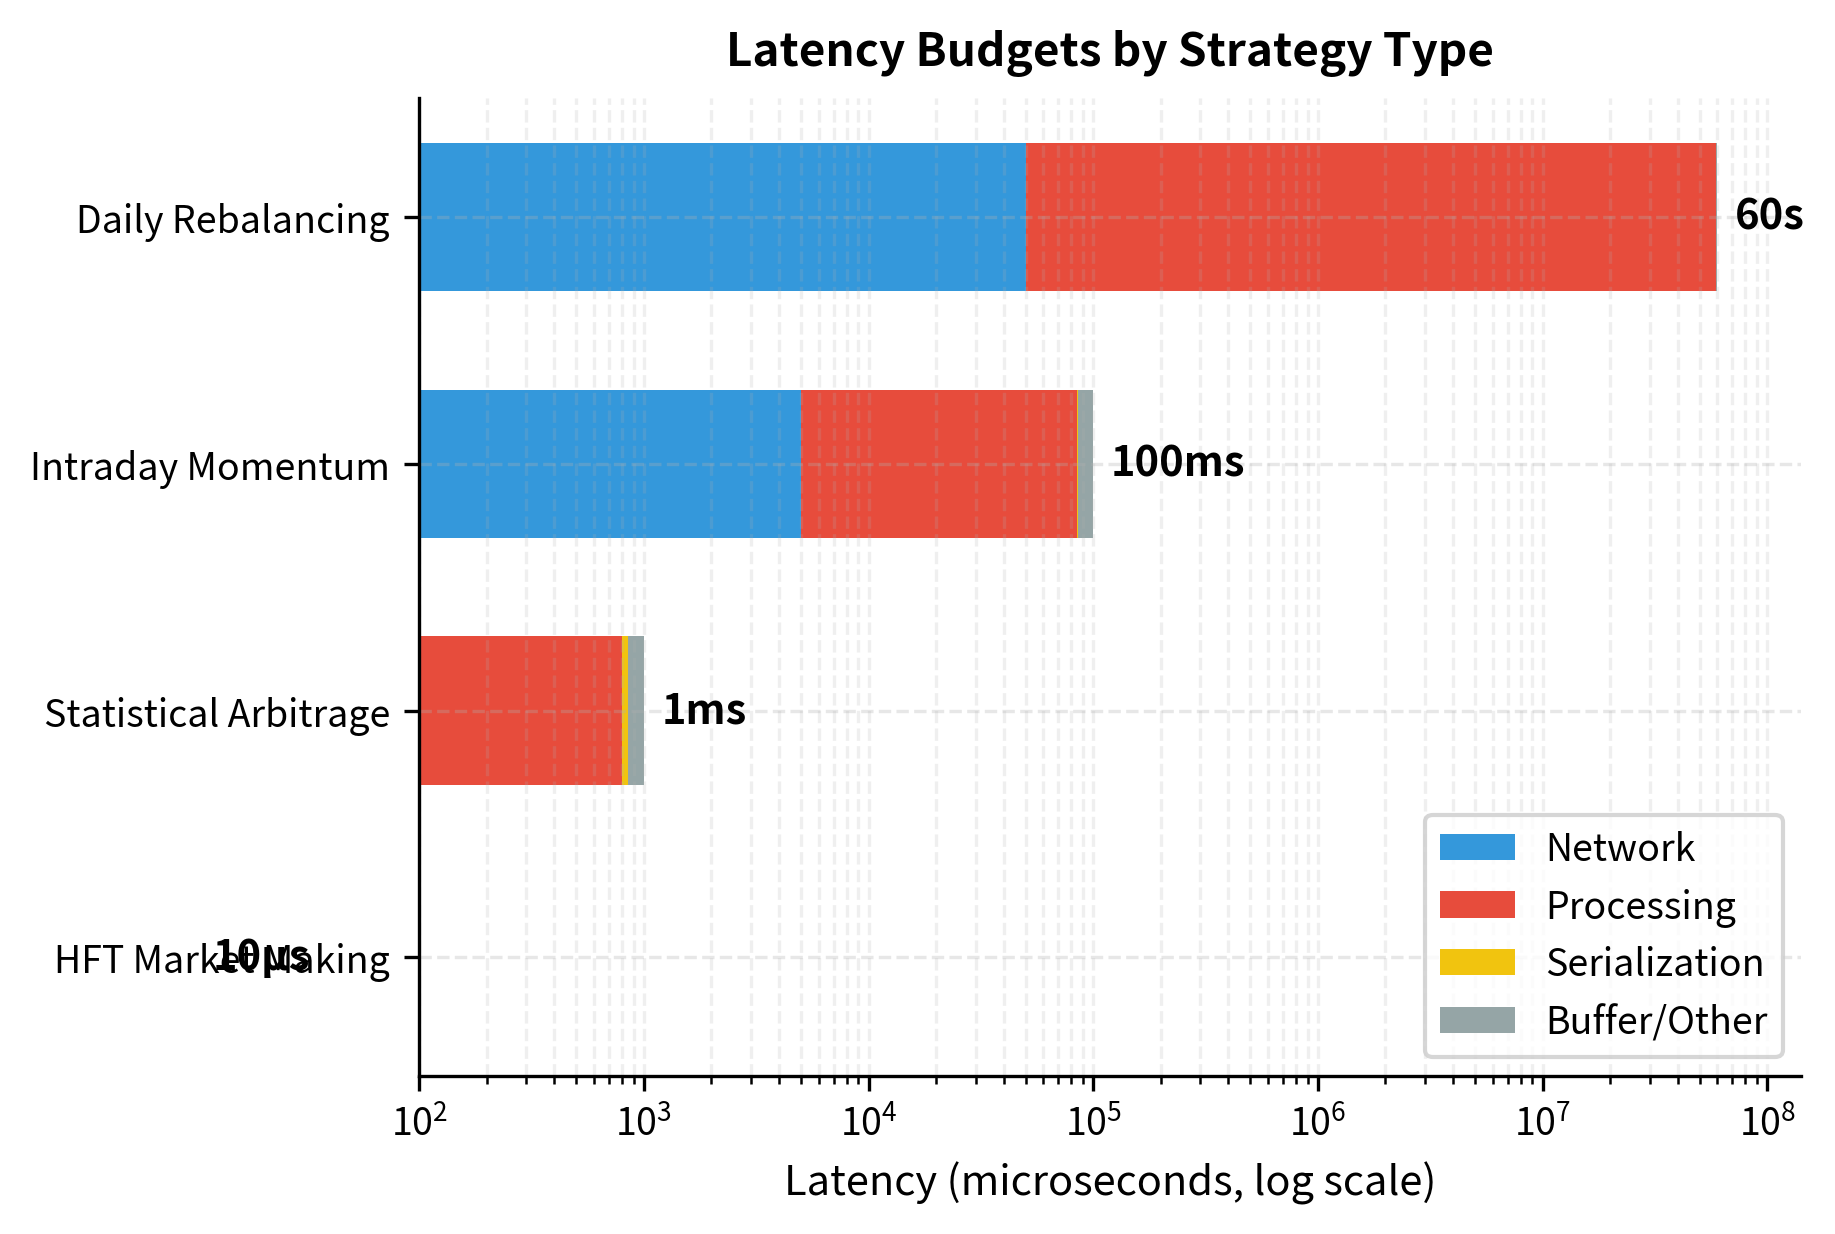
The table highlights how latency requirements scale from microseconds for HFT to seconds for daily rebalancing, dictating the necessary choice of language and infrastructure. A daily rebalancing strategy has no reason to invest in co-location or C++ development; the execution quality benefit would be negligible. Conversely, an HFT market-making strategy cannot function without these investments.
Hardware Optimization
For strategies where microseconds matter, hardware optimization becomes essential. The software-only optimizations described above eventually hit physical limits, and further improvement requires specialized hardware.
Co-location places your servers physically in the exchange's data center, minimizing network latency. The distance from your server to the exchange's matching engine can be measured in meters. Co-location providers offer rack space in the same building as the exchange, with cross-connects measured in nanoseconds rather than milliseconds. The cost is substantial, but for latency-sensitive strategies, co-location is a prerequisite for competition.
FPGA (Field Programmable Gate Arrays) implement trading logic directly in hardware, achieving sub-microsecond processing times. FPGAs are reprogrammable, allowing updates without manufacturing new chips. Unlike CPUs that execute instructions sequentially, FPGAs can process multiple data paths simultaneously, eliminating the pipeline stalls and cache misses that limit software performance. The tradeoff is development complexity: FPGA programming requires specialized skills and significantly longer development cycles.
Microwave and laser links transmit data between data centers faster than fiber optic cables. The straight-line microwave path between Chicago (CME) and New Jersey (NYSE/NASDAQ) is faster than any fiber route. These links exploit the fact that electromagnetic waves travel faster through air than through glass fiber, and that straight-line paths are shorter than the routes fiber must take around obstacles.
In HFT terms, the calculated advantage of over 2,000 microseconds can determine who captures an arbitrage opportunity. When two traders see the same price discrepancy, the one whose signal arrives first and whose order reaches the exchange first captures the profit. A 2-millisecond advantage is an eternity in this context.
For most quantitative strategies, even many that trade intraday, these extreme optimizations are unnecessary. The strategies where microseconds matter (market making, latency arbitrage) represent a small fraction of quantitative trading. As we discussed in the High-Frequency Trading chapter, competing on latency requires substantial infrastructure investment and increasingly yields diminishing returns as the field matures.
Portfolio and Order Management Systems
Professional trading operations require systems to track positions, monitor P&L, and ensure compliance with trading rules, in real time. These systems provide the ground truth about what the firm owns and owes, which is essential for both trading decisions and regulatory compliance.
The challenge of portfolio and order management is maintaining consistency across distributed systems under concurrent updates. Multiple strategies may be trading the same instrument simultaneously. Orders may be partially filled. Prices change continuously. The systems must provide accurate, up-to-date information despite this complexity.
Order Management System (OMS)
The OMS tracks the complete lifecycle of every order from creation through execution or cancellation. It serves as the authoritative record of trading activity and provides the data needed for reconciliation, compliance reporting, and strategy evaluation.
An order's lifecycle passes through several states: it is created, submitted to an exchange, potentially partially filled, and eventually either completely filled, cancelled, or rejected. Each transition must be recorded, and the current state must be available instantly for risk checks and strategy decisions.
The OMS tracks the state of each order, updating from PENDING to FILLED as simulated executions occur. Notice that the AAPL order received two partial fills at different prices, and the OMS correctly computes the average fill price across both fills. The MSFT order remains SUBMITTED because no fills have been received, illustrating the difference between orders that are working at the exchange and orders that have been executed.
Portfolio Position Tracking
The portfolio management system maintains real-time position and P&L information. This is the authoritative source of truth about what positions the firm holds and what those positions are worth. Every other component, from risk management to strategy generation, depends on accurate portfolio state.
The core challenge is tracking the cost basis of positions as they are accumulated through multiple trades. When you buy 100 shares at one price and then 50 more at a different price, your average cost must be updated correctly. When you sell, you realize gains or losses based on that average cost.
The portfolio summary aggregates cash and positions to calculate the Net Asset Value (NAV) and tracks both realized and unrealized P&L. Notice how the sale of 75 AAPL shares at 188.50 realized a profit because the sale price exceeded the average cost of the position. The remaining 75 AAPL shares continue to show unrealized profit as the current price exceeds the average cost.
Robustness and Testing
Production trading systems face adversarial conditions: data feeds fail, networks partition, and bugs lurk in rarely-executed code paths. Building robust systems requires defensive design, comprehensive testing, and fail-safe mechanisms. The financial consequences of system failures can be severe, from missed trading opportunities to catastrophic losses.
Robustness is not a feature that can be added after development; it must be designed in from the beginning. Every component should be designed to fail gracefully, every external dependency should be monitored, and every code path should be tested.
Circuit Breakers and Kill Switches
Circuit breakers automatically halt or reduce trading when anomalies are detected. They serve as the last line of defense against runaway losses, protecting the firm from scenarios where automated trading goes wrong.
The concept comes from electrical engineering, where circuit breakers prevent fires by cutting power when current exceeds safe levels. In trading, circuit breakers cut trading activity when metrics exceed safe levels. The goal is the same: prevent a small problem from becoming a catastrophe.
The circuit breaker monitors the trading activity and halts the system when the daily loss limit is breached in the final scenario. Notice that once the breaker trips, it stays tripped. Resetting requires explicit action (simulated here by the password check), ensuring that a human reviews the situation before trading resumes.
Testing Strategies
Comprehensive testing validates that your system behaves correctly under all conditions. Testing is not a phase that happens after development; it's an ongoing practice that shapes how code is written and systems are designed.
Unit tests verify individual components in isolation. Each function should have tests covering normal inputs, edge cases, and error conditions. Unit tests run quickly and catch bugs early in development.
Integration tests verify that components work together correctly. Test the full flow from data ingestion through order generation. Integration tests catch issues that arise from component interactions, such as data format mismatches or timing dependencies.
Simulation tests run your system against historical data with simulated execution. Compare results to your backtests to ensure consistency. Simulation tests verify that the production system implements the same logic as the research backtester.
Chaos testing deliberately injects failures to verify graceful degradation. What happens when a data feed disconnects mid-day? When an order is rejected? When prices gap? Chaos testing reveals weaknesses in error handling that normal testing doesn't expose.
The chaos testing framework injects simulated failures, allowing us to verify how the system handles connection drops and order rejections. Running chaos tests regularly uncovers edge cases in error handling code that rarely executes under normal conditions.
Data Validation and Sanity Checks
Never trust incoming data without validation. Market data contains errors more often than you might expect. Exchange systems have bugs, network errors corrupt packets, and data vendors occasionally publish incorrect values.
The consequences of trading on bad data can be severe. An erroneous price might trigger large orders in the wrong direction, or risk calculations might fail to recognize dangerous positions. Robust validation catches these issues before they affect trading decisions.
The validator flags invalid prices and crossed markets, preventing bad data from triggering erroneous trading signals. Notice that after rejecting the zero price, the validator continues to work correctly for subsequent valid prices. This resilience is essential; a single bad data point should not permanently break the system.
Putting It All Together
A complete trading system integrates all these components into a cohesive whole. The challenge is not just building each component correctly, but ensuring they work together seamlessly under the dynamic conditions of real markets.
The following example shows a simplified trading system that connects the components we've discussed. In production, this integration would be more sophisticated, with proper threading, error handling, and monitoring. But the basic structure illustrates how data flows through the system from market updates to trading decisions.
The integrated simulation shows the system in action. Market data drives the strategy, which generates signals that pass through risk checks before becoming orders. The portfolio manager tracks the resulting execution and P&L, providing a complete view of the trading operation. This demonstration illustrates the flow of information through the system, though production systems would include many additional features for reliability and compliance.
Limitations and Practical Considerations
Building production trading systems involves challenges beyond what simplified examples can convey. The gap between educational examples and production reality is substantial, and understanding this gap helps set appropriate expectations.
Complexity compounds rapidly. The integrated system above handles a few securities with basic logic. Production systems manage thousands of instruments, multiple strategies, various asset classes, and complex position limits. Every additional feature multiplies the potential for bugs and unexpected interactions. Firms invest heavily in testing, monitoring, and documentation to manage this complexity. What seems like a simple change can have ripple effects throughout the system.
Latency is harder than it appears. Achieving consistent low latency requires attention to details that aren't visible in high-level code: memory allocation patterns, cache line alignment, operating system tuning, network stack configuration, and hardware selection. A single garbage collection pause can cost milliseconds, an eternity in HFT. For most strategies, this level of optimization isn't necessary, but for latency-sensitive strategies, it dominates engineering effort.
Operations consume significant resources. Running a trading system requires 24/7 monitoring, on-call engineers, disaster recovery procedures, and regular maintenance. Data feeds need monitoring for quality degradation. Execution venues change their APIs and protocols. Regulatory requirements evolve. The "last mile" of deployment and operations often consumes more resources than strategy development.
Testing in production is unavoidable but dangerous. No matter how comprehensive your simulation testing, production behavior will differ. Markets have dynamics that historical data doesn't capture. Other participants adapt to your trading. You'll discover edge cases only when they occur. Paper trading (running strategies with simulated execution against live data) bridges some of this gap but doesn't eliminate it.
Vendor selection matters more than you'd think. Choosing data vendors, execution providers, co-location facilities, and software platforms locks you into dependencies that are expensive to change. Due diligence on vendors, including their reliability, support quality, and financial stability, pays dividends over the system's lifetime.
Summary
This chapter examined the infrastructure that transforms quantitative strategies from research to reality. The key takeaways are:
Trading systems comprise specialized components including data infrastructure, strategy engines, risk management systems, execution management, order management, and portfolio tracking. Each component has distinct requirements and design considerations.
Language and hardware choices depend on strategy requirements. Python excels for research and low-frequency strategies; C++ dominates latency-critical applications. Co-location, FPGAs, and specialized network links matter only for strategies where microseconds determine profitability.
Data quality underpins everything. Market data validation, point-in-time correctness for alternative data, and robust handling of data anomalies prevent garbage-in-garbage-out problems that corrupt strategy performance.
Risk management must be real-time and multi-layered. Pre-trade checks validate individual orders; portfolio-level monitoring tracks aggregate exposure; circuit breakers halt trading when anomalies occur.
Robustness requires defensive design. Assume data feeds will fail, orders will be rejected, and edge cases will occur. Build systems that fail safely and recover gracefully.
In the next chapter, we'll explore the research pipeline and strategy deployment process, examining how strategies move from conception through research to production, and how to manage that lifecycle effectively.
Quiz
Ready to test your understanding? Take this quick quiz to reinforce what you've learned about trading systems and infrastructure.

Comments