

Master ethical quantitative trading by learning to detect spoofing, navigate Reg NMS and MiFID II, implement kill switches, and ensure data privacy compliance.
Choose your expertise level to adjust how many terms are explained. Beginners see more tooltips, experts see fewer to maintain reading flow. Hover over underlined terms for instant definitions.
Ethical and Regulatory Considerations
Throughout this book, you have learned to build sophisticated quantitative models: from pricing derivatives with Black-Scholes and Monte Carlo simulation, to constructing factor portfolios, to deploying machine learning-driven trading strategies. Each of these techniques gives you power to act in financial markets at speed and scale. But power without responsibility is dangerous, both to markets and to yourself.
This chapter addresses the ethical and regulatory boundaries within which all quantitative strategies must operate. These are not afterthoughts or bureaucratic obstacles. They are fundamental constraints that shape strategy design from the outset. A brilliant alpha signal is worthless if it relies on material non-public information. A profitable market-making algorithm is a liability if it inadvertently engages in spoofing. A high-frequency strategy that destabilizes markets during stress events harms the very ecosystem you depend on for profits.
The 2010 Flash Crash, the LIBOR manipulation scandal, the "London Whale" incident, and numerous spoofing prosecutions all illustrate what happens when quantitative sophistication outpaces ethical judgment and regulatory compliance. You are not merely solving optimization problems. You are participating in a market infrastructure that allocates capital, prices risk, and supports economic activity for billions of people.
We begin with the forms of market manipulation most relevant to algorithmic and quantitative trading, then survey the regulatory frameworks that govern modern markets, examine the compliance infrastructure needed in a trading firm, consider the fairness debates surrounding high-frequency trading, and conclude with the ethical dimensions of data usage and your broader responsibilities.
Market Manipulation and Prohibited Practices
Market manipulation encompasses any conduct designed to artificially influence the price or volume of a security, commodity, or derivative. For you, the relevant forms of manipulation are often subtle and can arise from algorithmic behavior that was not explicitly designed to manipulate but produces manipulative effects nonetheless. This is a crucial distinction. Unlike a rogue human trader who consciously decides to deceive the market, an algorithm can generate patterns that regulators interpret as manipulative even if you never intended such an outcome. The algorithm simply followed its logic, but that logic, when interacting with a complex market ecosystem, produced behavior indistinguishable from deliberate misconduct. Understanding these prohibited practices is therefore essential for designing compliant strategies, because ignorance of the law, and ignorance of your own algorithm's emergent behavior, is no defense.
Spoofing and Layering
Spoofing is the practice of placing orders with the intent to cancel them before execution, creating a false impression of supply or demand to move prices in a desired direction. It was explicitly criminalized in the United States by the Dodd-Frank Act of 2010.
Spoofing is perhaps the most relevant form of manipulation for algorithmic traders, because it exploits the very mechanism through which modern electronic markets convey information: the limit order book. To understand why spoofing is so effective and so harmful, recall that every participant in an electronic market makes decisions partly based on the visible queue of resting orders. A large sell order sitting above the current ask signals to other participants that substantial selling interest exists at that level. Market makers adjust their quotes, directional traders recalibrate their expectations, and execution algorithms modify their behavior, all in response to what the order book displays. A spoofer exploits this informational role by injecting false signals. A spoofer might place a large sell order above the current ask to create the appearance of selling pressure, driving the price down, then buy at the artificially depressed price before canceling the spoofed order. The key legal element is intent: placing orders you do not intend to execute.
Layering is a related technique where a trader places multiple orders at different price levels on one side of the book, none of which are intended to trade, to create the illusion of deep liquidity or directional pressure. As we discussed in the chapter on market microstructure and order types, the order book's visible depth strongly influences other participants' trading decisions. Layering exploits this by manufacturing false depth. Where spoofing might involve a single large phantom order, layering creates a cascade of orders at progressively deeper price levels, painting a picture of overwhelming directional conviction that does not actually exist. The cumulative visual effect on the order book is even more persuasive than a single spoofed order, because it mimics the natural pattern of genuine limit order accumulation.
The prosecution of Navinder Singh Sarao, who was convicted of spoofing in connection with the 2010 Flash Crash, illustrates the severity with which regulators treat this behavior. Sarao used automated programs to rapidly place and cancel large E-mini S&P 500 futures orders, and was sentenced to one year of home detention and ordered to forfeit over $12.8 million. His case is instructive for you not only because of the legal consequences but because it demonstrates how a single individual, operating from a modest home setup, could influence one of the world's most liquid futures markets through algorithmic order manipulation.
For you, the risk is that a legitimate algorithm might exhibit spoofing-like patterns. Consider a market-making algorithm that continuously updates its quotes in response to changing market conditions. Each update involves canceling the previous quote and replacing it with a new one. If the algorithm updates rapidly and cancels a high percentage of its orders, the resulting pattern of frequent large cancellations can look, from a surveillance system's perspective, remarkably similar to spoofing. If your market-making strategy, like those we explored in the chapter on market making and liquidity provision, routinely cancels a high percentage of orders due to rapid quote updates, you should document the economic rationale and ensure that cancellations are driven by genuine inventory management or market condition changes, not by an intent to mislead. This documentation is not merely good practice; it is your primary defense if regulators ever question your trading activity.
Front-Running and Information Misuse
Front-running occurs when a trader executes orders on their own behalf ahead of a known pending client order, profiting from the anticipated price impact. This is a breach of fiduciary duty and is prohibited under securities law in virtually all jurisdictions. The harm is straightforward: the front-runner profits at the client's expense, because the front-runner's own trades move the price against the client before the client's order executes.
For you, front-running concerns arise in several contexts:
- Broker-dealer algorithms that can observe client order flow and trade ahead of it
- Co-location arrangements where a firm's proprietary strategies might gain advance knowledge of other participants' orders
- Information barriers (also known as "Chinese walls") that must separate client-facing operations from proprietary trading desks
A subtler variant is latency arbitrage, which we examined in the chapter on high-frequency trading and latency arbitrage. While exploiting speed advantages to react faster to public information is generally legal, the line between legitimate speed-based trading and abusive practices can be thin. The conceptual distinction matters: reacting faster to a public news event is different from observing a client's pending order and racing ahead of it. Both involve speed, but the informational basis is fundamentally different. Regulators increasingly scrutinize whether certain latency advantages constitute an unfair market structure, particularly when the speed advantage derives not from superior analysis but from privileged physical proximity to exchange matching engines.
Insider Trading
Information is considered material if a reasonable investor would consider it important in making an investment decision. It is non-public if it has not been disseminated broadly to the marketplace. Trading on MNPI, or tipping others to do so, constitutes insider trading.
Insider trading prohibitions apply to you just as they do to discretionary investors. The mathematical sophistication of your model provides no exemption: if the inputs to that model include material non-public information, the outputs are tainted regardless of how many layers of statistical transformation lie between the raw data and the trading signal. The relevance for you surfaces particularly in two areas.
First, alternative data may inadvertently contain or be derived from MNPI. As we discussed in the chapter on alternative data and NLP in quant strategies, data sources such as satellite imagery, web scraping, and transaction data can blur the line between clever research and misuse of confidential information. Consider a scenario where a data vendor obtains credit card transaction records from a payment processor. If those records reveal, before a public earnings announcement, that a retailer's sales have collapsed, trading on that signal may constitute insider trading. The critical question is how the data was obtained and whether any duty of confidence was breached in the process. If you obtain data through a breach of a duty of trust or confidence, trading on it may constitute insider trading regardless of how sophisticated your model is.
Second, event-driven strategies that trade around mergers, earnings, or regulatory decisions, as covered in the chapter on event-driven and arbitrage strategies, must be especially careful that their information edge comes from superior analysis of public information, not from tips or leaks. The line between "mosaic theory" (piecing together individually non-material public information to form a material conclusion) and insider trading is one that you must understand thoroughly.
Wash Trading and Market Manipulation Schemes
Wash trading involves simultaneously buying and selling the same instrument to create misleading activity data. The purpose is to inflate volume figures, making an instrument appear more liquid or more actively traded than it actually is. In traditional markets, this is well understood and prohibited. However, as we discussed in the chapter on cryptocurrency markets and quant trading, wash trading has been particularly prevalent in less regulated crypto exchanges, where it inflates volume figures to attract traders. Some studies have estimated that a substantial fraction of reported cryptocurrency trading volume is fabricated through wash trading, which has significant implications for any quantitative strategy that uses volume as an input signal.
Other manipulation schemes include:
- Pump-and-dump: Artificially inflating a security's price through false or misleading statements, then selling at the inflated price. Social media has enabled new variants of this old scheme, with coordinated campaigns on platforms like Reddit, Telegram, and Discord replacing the boiler rooms of earlier decades.
- Marking the close: Executing trades near market close to influence the closing price, which affects derivatives settlement, index calculations, and portfolio valuations. Because so many financial contracts reference the official closing price, even small distortions at the close can have outsized economic consequences.
- Cornering and squeezing: Accumulating a dominant position in a security or commodity to force other participants (particularly short sellers) into unfavorable trades. The GameStop episode of January 2021, while driven partly by retail coordination rather than a single actor, illustrated the dynamics of a short squeeze in vivid and very public fashion.
Regulatory Framework Overview
Financial markets operate under layers of regulation that vary by jurisdiction, asset class, and participant type. These layers have accumulated over decades, each typically enacted in response to a specific crisis or market failure. The result is a complex patchwork of rules that quantitative traders must navigate, often simultaneously across multiple jurisdictions. This section provides an overview of the key regulatory frameworks that you encounter, focusing on rules that directly affect strategy design and implementation.
United States: The SEC, CFTC, and Key Regulations
The U.S. regulatory landscape for quantitative trading is shaped primarily by the Securities and Exchange Commission (SEC) for equities and options, and the Commodity Futures Trading Commission (CFTC) for futures and commodities. This dual-regulator structure, a historical artifact of how agricultural futures and corporate securities developed as separate markets, means that a quantitative firm trading both equities and futures must comply with two distinct regulatory regimes, each with its own rules, reporting requirements, and enforcement philosophies. Several regulations are especially relevant:
-
Regulation NMS (National Market System): Adopted in 2005, Reg NMS established rules designed to ensure fair and efficient equity markets. Its Order Protection Rule (Rule 611) requires that trades execute at the best available price across all exchanges, which directly shapes the routing logic in execution algorithms like those we built in the chapter on execution algorithms and optimal execution. The rule also prohibits trade-throughs: executing at a price worse than a protected quotation displayed on another venue. For you, this means that your smart order router must be aware of the national best bid and offer (NBBO) at all times and must route orders in a way that respects price priority across all lit venues. Failure to do so exposes both the executing broker and the trading firm to regulatory liability.
-
Regulation SHO: Governs short selling, including locate requirements (you must reasonably believe shares can be borrowed before selling short) and the alternative uptick rule, which restricts short selling when a stock has dropped more than 10% in a day. Short-selling strategies, including the long/short equity approaches from Part VI, must incorporate these constraints. In practice, this means your execution system must query a locate inventory before submitting any short sale, and must monitor intraday price movements to determine whether the alternative uptick rule has been triggered for any security in your universe.
-
The Dodd-Frank Wall Street Reform and Consumer Protection Act (2010): Enacted after the 2008 financial crisis, Dodd-Frank brought sweeping changes including the Volcker Rule (restricting proprietary trading by banks), mandatory clearing for standardized OTC derivatives, and the explicit prohibition of spoofing in commodities markets. The Volcker Rule is particularly relevant for you when working within banking institutions, as it restricts the types of proprietary trading activities that banks can engage in, requiring firms to demonstrate that trading activity serves legitimate market-making, hedging, or underwriting purposes rather than speculative proprietary profit.
-
Regulation ATS (Alternative Trading System): Governs dark pools and other non-exchange trading venues. If your execution algorithms route to dark pools to minimize market impact, as discussed in the transaction costs chapter, you should understand the disclosure requirements and fair access rules that apply to these venues. Dark pools offer the benefit of reduced information leakage, but they also introduce risks related to adverse selection and potential conflicts of interest when the dark pool operator also trades for its own account.
-
CFTC Position Limits: The CFTC imposes speculative position limits on certain commodity futures and options contracts to prevent excessive speculation. As we covered in the chapter on commodity markets and futures, these limits cap the number of contracts a speculative trader can hold in a given commodity, and quantitative commodity strategies must monitor positions against these thresholds. Exceeding a position limit, even briefly, can result in enforcement action, so real-time position monitoring against these caps must be integrated into your risk management infrastructure.
European Union: MiFID II and MAR
The European regulatory framework has converged around two major pieces of legislation that significantly affect quantitative trading:
-
MiFID II (Markets in Financial Instruments Directive II): Effective since January 2018, MiFID II imposes extensive requirements on algorithmic trading, including mandatory registration of algorithmic trading firms, requirements to have effective risk controls and circuit breakers, obligations to provide regulators with detailed descriptions of algorithmic strategies, and record-keeping requirements for all orders (including cancelled orders) for five years. MiFID II represents one of the most comprehensive regulatory frameworks for algorithmic trading anywhere in the world. Its requirements go beyond merely prohibiting bad behavior; they prescribe specific operational standards that firms must meet. For a quantitative trading firm, this means that every algorithm must be documented in sufficient detail that a regulator could understand its logic, its risk parameters, and its expected behavior under various market conditions.
-
MAR (Market Abuse Regulation): MAR defines and prohibits market manipulation, insider dealing, and unlawful disclosure of inside information across the EU. It explicitly covers algorithmic trading strategies and requires firms to have systems in place to detect and report suspicious orders and transactions. Importantly, MAR applies not only to the firm's own trading but also to the firm's obligation to identify and report suspicious activity by others. This means that your surveillance systems must monitor not just your own algorithms but also the patterns you observe in the broader market.
MiFID II also introduced the concept of a double volume cap mechanism, which limits the proportion of trading in a given instrument that can occur in dark pools, directly affecting execution strategies in European markets. This cap was designed to address concerns that too much trading was migrating away from lit venues, reducing price transparency for all participants.
Position Reporting and Transparency Requirements
Across jurisdictions, you face various position reporting obligations that serve the dual purpose of enabling regulatory oversight and providing market transparency:
- 13F filings (SEC): Institutional investment managers with over $100 million in qualifying assets must disclose their equity holdings quarterly. This is why hedge fund positions become public information with a delay, creating the "13F-following" strategies we may employ. The 45-day reporting delay means the information is stale by the time it becomes public, but it still provides a valuable window into institutional positioning and can influence market dynamics as other participants react to the disclosed holdings.
- Large Trader Reporting: The SEC's Rule 13h-1 requires entities whose trading activity exceeds certain thresholds to register as large traders and obtain a Large Trader Identification Number. This number must be provided to broker-dealers, enabling the SEC to reconstruct the trading activity of large participants when investigating market events.
- Form PF: Required for large private fund advisers, providing the SEC and FSOC with data on systemic risk. Form PF collects information about fund leverage, liquidity, counterparty exposures, and trading strategies, giving regulators a window into the activities of private funds that might otherwise operate with minimal transparency.
These reporting requirements mean that your strategy's positions are never entirely private, and the regulatory cost of reporting must be factored into operational planning.
Global Convergence and Divergence
While the broad principles of market integrity are universal, important differences exist across jurisdictions. Short-selling bans are more common in some Asian and European markets. Cryptocurrency regulation varies dramatically, from comprehensive frameworks in the EU (MiCA) to evolving approaches in the U.S. and minimal regulation in some offshore jurisdictions. Tax treatment of trading profits, wash sale rules, and beneficial ownership disclosure thresholds all differ by country.
For quantitative firms trading across multiple markets, regulatory compliance becomes a complex multi-dimensional optimization problem in its own right. A single strategy deployed across U.S., European, and Asian markets must simultaneously satisfy distinct and sometimes conflicting regulatory requirements, from different short-selling rules to different position reporting thresholds to different definitions of what constitutes market manipulation. This complexity is one reason why larger quantitative firms employ dedicated regulatory teams for each major jurisdiction.
Algorithmic Trading Regulations and Safeguards
The speed and automation of algorithmic trading create unique regulatory challenges. A human trader making errors affects the market one trade at a time. An algorithm with a bug can flood the market with thousands of erroneous orders per second. The asymmetry is stark: the potential for harm scales with the speed and volume of the algorithm, which means that the safeguards must be equally automated and equally fast. Regulators have responded with specific requirements for algorithmic trading systems, recognizing that traditional supervisory approaches designed for human traders are insufficient in a world where decisions are made in microseconds.
Kill Switches and Circuit Breakers
A kill switch is an automated mechanism that immediately halts an algorithm's trading activity when predefined risk thresholds are breached. It may cancel all outstanding orders, flatten positions, and prevent new orders from being submitted.
The concept of a kill switch is straightforward, but its implementation requires careful engineering. The switch must be fast enough to activate before significant damage occurs, reliable enough to function even when other systems are failing, and independent enough that the same bug affecting the trading algorithm cannot also disable the kill switch. In practice, many firms implement kill switches on separate hardware from the trading system itself, precisely to ensure that a software failure in the trading logic does not compromise the safety mechanism.
Both exchange-level and firm-level circuit breakers serve as safety nets. Exchange-level mechanisms include the Limit Up-Limit Down (LULD) mechanism for U.S. equities, which pauses trading when a stock's price moves beyond specified percentage bands, and market-wide circuit breakers (MWCB) that halt all trading when major indices decline by 7%, 13%, or 20% from the prior close. These exchange-level mechanisms provide a backstop for the entire market, but they activate only after significant price dislocations have already occurred. Firm-level controls, by contrast, can catch problems earlier and prevent the firm from contributing to broader market disruption.
At the firm level, the SEC's Market Access Rule (Rule 15c3-5) requires broker-dealers to implement risk management controls before providing customers with market access. These pre-trade risk controls include:
- Order-level checks: Maximum order size, price collars (rejecting orders too far from the current market), and symbol-level restrictions
- Aggregate exposure limits: Maximum gross or net position value, maximum daily loss, and maximum message rates
- Credit checks: Ensuring orders do not exceed the firm's or client's credit limits
As we discussed when building trading systems infrastructure in Part VII, these controls must be implemented in the critical path of order submission, adding latency but providing essential protection. The tension between speed and safety is real: every microsecond spent on risk checks is a microsecond of additional latency. But the cost of a single unchecked erroneous order can far exceed the cumulative cost of latency across millions of checked orders.
Pre-Trade and Post-Trade Risk Controls
A robust algorithmic trading system implements risk controls at multiple levels, forming a layered defense against errors, malfunctions, and unintended behavior. The philosophy is similar to the defense-in-depth principle used in cybersecurity: no single control is assumed to be perfect, so multiple overlapping controls ensure that a failure at one level is caught by another. Building on the infrastructure concepts from the chapter on quant trading systems and infrastructure, here is a framework for thinking about these controls:
Pre-trade controls evaluate each order before it reaches the market. These are the most critical controls because they prevent problematic orders from ever entering the market:
- Does the order size exceed the maximum allowed for this instrument?
- Is the order price within an acceptable range of the current market price?
- Would this order cause the portfolio's aggregate exposure to breach a limit?
- Has the algorithm exceeded its maximum order rate?
Each of these checks addresses a specific failure mode. The order size check catches "fat-finger" errors where a quantity field might contain an erroneous value. The price collar check catches situations where a stale or corrupted price feed leads the algorithm to submit an order at a wildly incorrect price. The aggregate exposure check prevents the algorithm from accumulating a position larger than the firm's risk appetite permits. The order rate check guards against runaway loops where a software bug causes the algorithm to submit orders at an uncontrolled rate.
In-flight controls monitor the algorithm's behavior in real time while it is actively trading:
- Are cumulative losses approaching a threshold?
- Is the algorithm's behavior deviating from expected patterns?
- Are latency metrics degrading, potentially indicating a system malfunction?
In-flight controls are essential because problems can emerge gradually rather than all at once. An algorithm might pass every individual pre-trade check while nonetheless drifting into dangerous territory in aggregate, for example, by slowly accumulating a larger and larger position through many individually small trades, each of which passes the order-level check but whose cumulative effect breaches the firm's risk limits.
Post-trade controls analyze completed activity after the fact:
- Did the algorithm's realized behavior match its intended strategy?
- Were there patterns that might appear manipulative to a regulator?
- Were all fills at prices consistent with best execution obligations?
Post-trade controls serve a different purpose from real-time controls. They allow the firm to identify subtle problems that may not trigger real-time alerts but that could indicate a deeper issue with the algorithm's behavior, a gradual drift in strategy characteristics, or emerging patterns that could attract regulatory scrutiny.
Record-Keeping and Audit Trails
Regulations require comprehensive record-keeping for algorithmic trading, reflecting the principle that regulators must be able to reconstruct exactly what happened and why during any period of market activity. MiFID II, for example, requires firms to store records of all orders (including modifications and cancellations) in a format that allows reconstruction of the order book at any point in time. This means your trading system must log:
- Every order submission, modification, and cancellation with microsecond timestamps
- The algorithm's decision state at the time of each order (why the order was generated)
- All risk control evaluations and any interventions
- System configuration changes and deployment events
The requirement to log the algorithm's decision state deserves particular emphasis. It is not sufficient to record merely that an order was submitted. You must also record the internal state of the algorithm at the moment the order was generated: what market data it was observing, what signals it was acting on, and what risk parameters were in effect. This level of detail is what allows a compliance team or regulator to determine, after the fact, whether the algorithm was behaving as intended.
These records serve dual purposes: they enable internal analysis for strategy improvement (as we discussed in the backtesting chapter) and satisfy regulatory examination requirements. A regulator investigating unusual trading activity may request your complete order audit trail, and the burden is on you to produce it. Failure to maintain adequate records, even in the absence of any actual misconduct, can itself result in regulatory sanctions.
Building Compliance Monitoring Tools
Let us put these concepts into practice by building tools that a compliance team at a quantitative trading firm might use to monitor for potentially problematic trading behavior. These examples illustrate how the programming and analytical skills you have developed throughout this book apply to compliance. The tools we build here are deliberately simplified for pedagogical clarity, but they embody the same core logic that production compliance systems use at scale.
Detecting Potential Spoofing Patterns
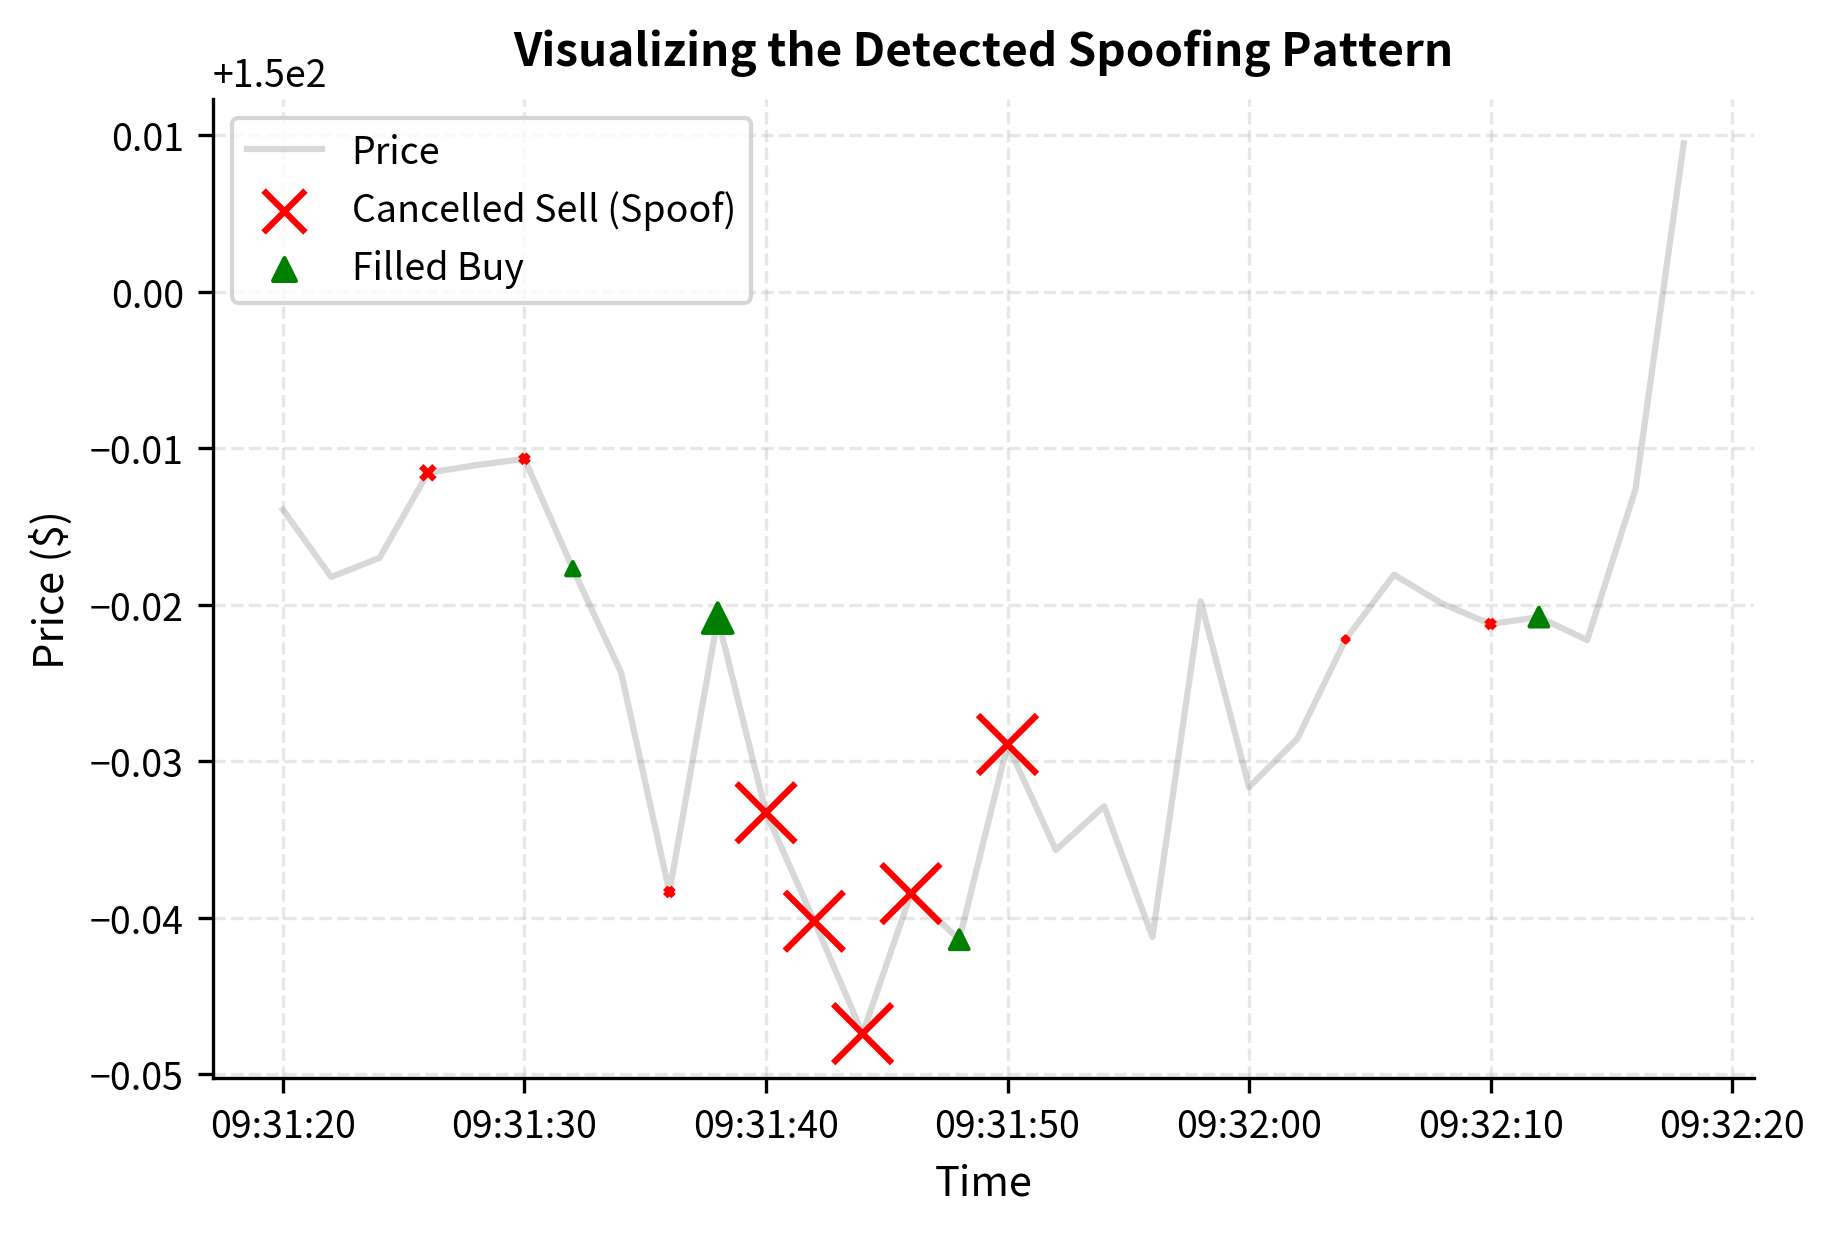
A basic spoofing detection system looks for patterns where a trader places large orders that are cancelled shortly after a fill occurs on the opposite side. The underlying intuition is grounded in the definition of spoofing itself: the spoofer's goal is to create a false impression of supply or demand on one side of the market in order to execute profitably on the other side. Therefore, the telltale signature is an asymmetry between displayed intent and actual execution. On one side of the book, the trader places large orders that are overwhelmingly cancelled. On the other side, the trader executes smaller orders that are overwhelmingly filled. This combination of high cancellation rates on one side and profitable fills on the other is the core signal that spoofing detection systems are designed to identify.
We can build a simple detector that flags suspicious order sequences. First, let us construct a synthetic order dataset that includes both normal trading activity and an injected spoofing-like pattern. The injected pattern consists of a cluster of large sell orders that are all cancelled, interspersed with a small buy order that is filled, mimicking a spoofer who places phantom sell pressure to depress the price and then buys at the artificially lowered level.
Now we build the spoofing detection logic. The key insight is to look for asymmetric behavior: large orders on one side that are disproportionately cancelled, while smaller orders on the opposite side are filled. The algorithm works by sliding a time window across the order history and, within each window, computing two critical metrics for each side of the market. The first metric is the cancellation ratio: the fraction of orders on one side that were cancelled rather than filled. The second metric is the size ratio: the average size of the cancelled orders relative to the average size of the filled orders on the opposite side. When both metrics simultaneously exceed their respective thresholds, it indicates that a trader was displaying large phantom orders on one side (high cancel ratio of large orders) while executing smaller genuine orders on the other side (small fills), which is precisely the signature of spoofing.
This detector successfully identifies the injected spoofing pattern. To better understand what the compliance system is flagging, let's visualize the specific sequence of events that triggered the alert.
In production, such a system would be far more sophisticated, incorporating order book reconstruction, cross-instrument analysis, and machine learning classifiers trained on known manipulation cases. Production systems also account for the temporal sequencing of events more precisely: not just whether cancellations and fills co-occur within a window, but whether the cancellations systematically precede the fills in a way that suggests the cancelled orders were placed to influence the price at which the fills occurred. But the core principle remains: look for asymmetries between displayed intent (large orders placed) and actual behavior (those orders cancelled while profiting on the other side).
Key Parameters
The key parameters for the spoofing detection algorithm are carefully chosen to balance sensitivity against specificity spoofing) against specificity (avoiding false positives that would overwhelm the compliance team with spurious alerts):
- window_seconds: The time window for analyzing order patterns. Shorter windows catch rapid-fire manipulation where a spoofer places and cancels orders within seconds. Longer windows capture sustained pressure campaigns where the spoofer maintains phantom orders for minutes at a time. The appropriate window length depends on the market's typical activity pace and the style of manipulation you are trying to detect. In highly liquid futures markets, a window of 10 to 30 seconds may be appropriate, while in less liquid equity markets, windows of several minutes may be needed.
- cancel_ratio_threshold: The minimum proportion of orders on one side that must be cancelled to trigger an alert. Setting this too low generates excessive false positives, because legitimate market-making strategies routinely cancel a significant fraction of their quotes. Setting it too high risks missing genuine spoofing where the spoofer intermingles some filled orders with the phantom ones to mask the pattern. A threshold of 0.8, meaning at least 80% of orders on one side must be cancelled, provides a reasonable starting point.
- size_ratio_threshold: The ratio of average cancelled order size to average filled execution size on the opposite side. High ratios indicate asymmetric intent, because they reveal that the cancelled orders were much larger than the genuinely executed orders. A spoofer typically uses large phantom orders to create an impression of overwhelming supply or demand, while the actual profitable trades are relatively small. A threshold of 3.0 means the average cancelled order must be at least three times larger than the average filled order on the opposite side.
Monitoring Pre-Trade Risk Limits
Next, let us implement a pre-trade risk check system that an algorithm would call before submitting each order. This mirrors the kind of safeguard required by the SEC's Market Access Rule, which mandates that broker-dealers implement automated controls to prevent erroneous or excessive orders from reaching the market. The design philosophy is that every order, without exception, must pass through a series of validation checks before it is permitted to enter the market. If any single check fails, the order is rejected and the rejection reason is logged for audit purposes. This "fail-safe" approach means that the system defaults to rejecting orders when uncertain, which is the appropriate behavior for a safety mechanism.
The implementation below organizes the risk checks into a class that maintains state across multiple orders, tracking cumulative positions, daily profit and loss, and order counts. This statefulness is essential because many risk limits are aggregate in nature: a single order might be perfectly acceptable in isolation but problematic in the context of the day's accumulated activity.
Let us simulate a series of orders and observe how the risk manager handles them. We deliberately construct a sequence of orders that will trigger different risk controls, demonstrating how each check catches a specific category of problem. The first order is a normal, well-behaved order that should pass all checks. The second is excessively large. The third has a price far from the reference. The fourth arrives after a simulated period of severe losses. By observing which orders pass and which are rejected, and for what reason, we can see the layered defense in action.
The results show how different risk controls catch different types of problems, each acting as an independent safety layer. Order 1 passes all checks: its size is within bounds, its price is close to the reference, and neither the position limit nor the loss limit has been breached at that point. Order 2 is rejected for exceeding the maximum order size, which in a real trading environment would prevent a catastrophic "fat-finger" error where a trader accidentally enters 15,000 shares instead of 1,500. Order 3 is rejected because its price deviates more than 2% from the reference price, a price collar violation. This check exists to prevent the algorithm from trading at prices that are wildly inconsistent with current market conditions, which could happen if the algorithm receives a stale or corrupted price feed. Order 4 is rejected because the daily P&L has breached the loss limit, reflecting the firm's policy that once cumulative losses exceed a threshold, all trading must stop until the risk manager reviews the situation. Each rejection fires independently, catching the first violated constraint. This sequential checking approach means that an order may have multiple problems, but the system reports the first one encountered, which is typically sufficient for the compliance team to understand why the order was blocked.
Key Parameters
The key parameters for the pre-trade risk manager represent the core calibration decisions that a risk management team must make, balancing the need for safety against the need for the algorithm to operate effectively:
- max_order_size: The maximum quantity allowed for a single order, preventing "fat-finger" errors. This parameter should be calibrated to the typical order sizes for each instrument and strategy. A market-making algorithm in a large-cap equity might reasonably submit orders of several thousand shares, while a strategy trading illiquid small-cap stocks might warrant a much lower limit. Setting this too low constrains legitimate trading; setting it too high defeats the purpose of the check.
- price_collar_pct: The maximum allowable percentage deviation from a reference price. The reference price is typically the current mid-price or last traded price. A collar of 2% means that the algorithm cannot submit an order more than 2% away from the reference, which protects against situations where stale data or software bugs cause the algorithm to price orders far from the current market. In volatile markets, this collar may need to be widened temporarily to accommodate legitimate price swings.
- max_position: The absolute limit on net inventory per symbol. This prevents the algorithm from accumulating an excessively concentrated position in any single instrument, which would expose the firm to unacceptable single-name risk. The appropriate limit depends on the instrument's liquidity, the firm's capital base, and the strategy's expected holding period.
- max_daily_loss: The cumulative loss threshold that triggers a trading halt. This is perhaps the most critical parameter, because it provides a hard limit on the worst-case daily loss the firm is willing to tolerate from a given algorithm or trading desk. Once the daily P&L crosses this threshold, all new orders are blocked until a human reviews the situation and either resets the limit or shuts down the algorithm for the day.
Visualizing Order-to-Trade Ratios
Regulators monitor order-to-trade (OTR) ratios as a potential indicator of manipulative behavior. The OTR ratio is simply the number of orders submitted divided by the number of trades executed. Extremely high OTR ratios, where a firm submits many orders but executes very few, may indicate spoofing or excessive messaging. The logic is intuitive: if a firm is submitting thousands of orders for every trade it actually executes, it raises the question of what purpose those unexecuted orders serve. Some exchanges impose penalties for excessive OTR ratios, both to discourage potential manipulation and to reduce the computational burden that excessive messaging places on exchange matching engines. Let us visualize this metric across simulated trading desks to see how different strategy types produce different OTR profiles.
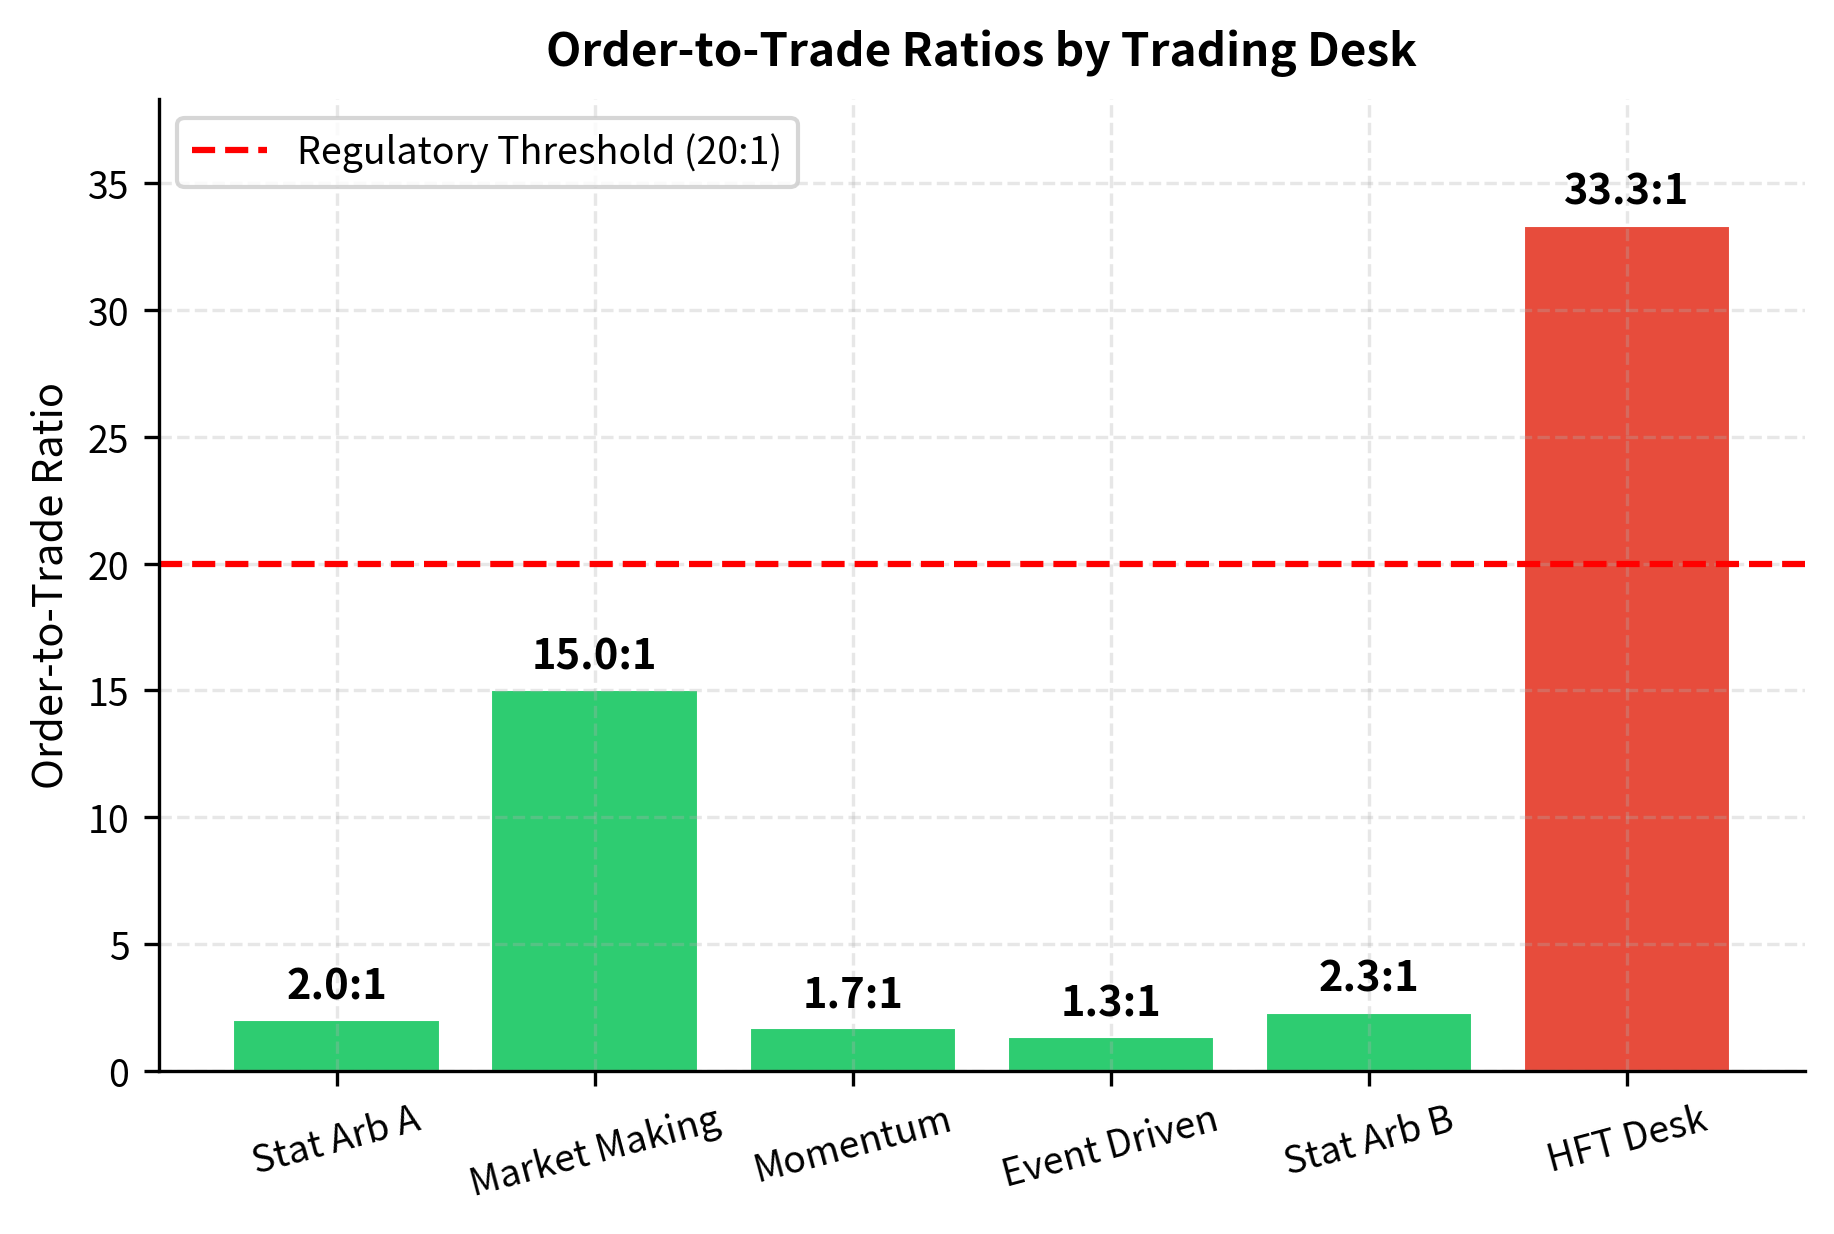
The HFT desk and market-making desk have the highest OTR ratios, which is expected given their frequent quote updates. A market maker must continuously update its bid and ask quotes to reflect changing market conditions, and each update involves canceling the old quote and submitting a new one. This legitimate activity naturally produces a high OTR ratio. Similarly, an HFT desk that reacts to microstructure signals may cancel and replace orders many times before a single trade executes. However, the HFT desk exceeds the hypothetical threshold, triggering enhanced surveillance. A high OTR ratio is not proof of manipulation: market makers legitimately update quotes thousands of times per second. But it warrants investigation and documentation of the economic rationale for the order activity. The compliance team would then examine whether the high ratio is explained by the desk's strategy type or whether it masks patterns consistent with spoofing or quote stuffing.
Key Parameters
The key parameter for the order-to-trade analysis is:
- otr_threshold: The regulatory or internal limit for the order-to-trade ratio. Ratios above this level trigger enhanced surveillance. The appropriate threshold varies by market and strategy type. Some European exchanges have set explicit OTR limits, while in the U.S. the threshold is more often determined by the firm's internal compliance policies and the exchange's fee schedules, which may impose surcharges for excessive order-to-trade ratios. The threshold should be calibrated with an awareness of what is normal for each strategy type: a threshold that is appropriate for a momentum strategy would generate constant false positives if applied to a market-making desk.
High-Frequency Trading and Market Fairness
The rise of high-frequency trading, which we examined in detail in the chapter on high-frequency trading and latency arbitrage, has sparked one of the most vigorous debates in modern market structure. You should understand both sides of this debate, because it directly affects how regulators shape the markets you trade in. Regulatory responses to HFT concerns can alter market microstructure in ways that create or destroy entire categories of strategy, making this debate one of practical, not merely academic, importance.
Arguments in Favor of HFT
Proponents of high-frequency trading point to several benefits:
- Tighter spreads: Bid-ask spreads in U.S. equities have narrowed dramatically since the advent of electronic and high-frequency market making. The average spread on large-cap stocks is now often a single penny, reducing transaction costs for all investors. This is a concrete, measurable benefit: every investor who buys or sells a share of a large-cap stock pays less in implicit transaction costs than they would have in the pre-HFT era.
- Improved price discovery: HFT firms rapidly incorporate new information into prices, making markets more efficient. Recall from the chapter on no-arbitrage principle and risk-neutral valuation that efficient pricing depends on information being quickly reflected in market prices. When economic data is released or a news event occurs, HFT firms are among the first to adjust their quotes, pulling prices toward their new equilibrium values faster than would occur in a market populated only by slower participants.
- Increased liquidity: During normal market conditions, HFT firms provide substantial liquidity, making it easier for institutional and retail investors to execute trades. The presence of multiple HFT market makers competing for order flow means that investors typically face tighter spreads and deeper order books than they would otherwise.
Arguments Against HFT
Critics raise several concerns:
- Phantom liquidity: The liquidity provided by HFT firms can evaporate precisely when it is most needed, during market stress. This is sometimes called "fair-weather liquidity." The 2010 Flash Crash demonstrated how quickly HFT liquidity can vanish. When prices began falling rapidly, many HFT firms withdrew from the market, widening spreads and accelerating the decline. The liquidity that appeared abundant during calm conditions proved illusory during the exact moments when it was most valuable.
- Latency arms race: The billions of dollars spent on co-location, microwave towers, and custom hardware represent a deadweight cost to the financial system: resources that produce no social value beyond being marginally faster than competitors. From a social welfare perspective, the question is whether the benefits of slightly faster price discovery justify the enormous investment required to achieve it.
- Structural unfairness: Retail and institutional investors who cannot afford co-location or custom hardware face a structural disadvantage, raising questions about market fairness and equal access. While proponents argue that retail investors still benefit from tighter spreads, critics contend that the playing field is fundamentally uneven in ways that undermine public confidence in markets.
- Systemic risk: The speed and interconnectedness of HFT strategies can amplify market dislocations, as algorithms react to each other's behavior in feedback loops faster than any human can intervene. When multiple algorithms interpret the same market signal and respond in the same way simultaneously, the resulting cascade of orders can move prices far beyond what fundamentals justify, as occurred during the Flash Crash.
Regulatory Responses to HFT Concerns
Regulators have taken various approaches to address HFT concerns, reflecting the genuine difficulty of balancing market efficiency against fairness and stability. The EU's MiFID II imposed algorithmic trading registration requirements, mandatory testing of algorithms, and kill switch requirements. Some exchanges have implemented speed bumps (IEX's 350-microsecond delay is the most well-known example) to reduce the advantage of raw speed. The IEX speed bump is designed to be long enough to neutralize the latency advantages that HFT firms gain from co-location, while being short enough to have no perceptible impact on slower traders. Minimum resting times for orders have been proposed in some jurisdictions, though not widely adopted. Such requirements would force every order to remain on the book for a minimum duration before it could be cancelled, directly targeting the rapid-fire cancellation patterns that characterize some HFT strategies.
The debate is far from settled, and as a quantitative practitioner you should remain aware that regulatory changes in this area can fundamentally alter the viability of speed-dependent strategies. A speed bump adopted by a major exchange, a new fee structure that penalizes high cancellation rates, or a minimum resting time requirement could render an otherwise profitable HFT strategy uneconomical overnight.
Ethical Use of Data
The explosion of alternative data, which we explored in the chapter on alternative data and NLP in quant strategies, raises ethical questions that go beyond legal compliance. Just because data is technically available does not mean it is ethically appropriate to use. The distinction between legality and ethics is critical here: legal standards define the floor of acceptable behavior, while ethical standards aspire to a higher ceiling.
Privacy Concerns
Many alternative data sources derive value from aggregating individual behavior. Credit card transaction data, mobile phone location data, social media activity, and web browsing patterns can all generate alpha signals. But the individuals whose data is being analyzed typically did not consent to their behavior being used to inform trading decisions. The aggregation itself does not eliminate the ethical concern: even when individual records are combined into aggregate statistics, the value of the data derives from monitoring individuals' private behavior.
Key ethical questions include:
- Consent and expectation: Did the data subjects reasonably expect their data to be used for financial trading? Even if a privacy policy technically permits it, does that reflect meaningful consent? A consumer who agrees to a credit card company's terms of service likely does not envision that their purchase history will be sold to a hedge fund and used to predict a retailer's quarterly earnings.
- Re-identification risk: Even "anonymized" datasets can sometimes be re-identified when combined with other data sources. A dataset showing purchase patterns at a specific store in a small town may effectively identify individuals. Research in data science has repeatedly demonstrated that supposedly anonymous datasets can be de-anonymized through linkage with other available information, raising the question of whether true anonymization is even achievable for many types of behavioral data.
- Data provenance: Was the data collected lawfully? Web scraping may violate terms of service. Purchasing data from vendors who obtained it through deceptive practices can expose you to legal and reputational risk. Your responsibility does not end at the point of purchase: if you know or should know that a data vendor's collection methods are ethically questionable, using that data implicates you in the ethical breach.
The Expert Network Problem
Expert networks, which connect analysts with industry experts, have been the source of numerous insider trading cases. The SAC Capital (now Point72) and Galleon Group prosecutions revealed how seemingly legitimate expert consultations can cross the line into tip-based trading. If you use expert networks or any form of primary research that involves speaking with corporate insiders, you need robust compliance protocols to document that no MNPI was exchanged. These protocols typically include pre-clearance of expert contacts, monitoring of conversations, and written records of the topics discussed and the information obtained.
Environmental, Social, and Governance (ESG) Considerations
A growing number of investors and regulators expect quantitative strategies to consider ESG factors, or at minimum to disclose their approach. Even if you are agnostic about ESG as an alpha source, you should be aware that:
- The EU's Sustainable Finance Disclosure Regulation (SFDR) requires fund managers to classify products by their sustainability characteristics
- Greenwashing (making misleading claims about ESG integration) is increasingly subject to regulatory scrutiny
- ESG data quality remains a challenge, as we noted in the alternative data chapter: different ESG rating providers often disagree substantially on the same company
Compliance Infrastructure in a Trading Firm
Compliance is not just a legal function: it is a technology and engineering challenge that quantitative firms must invest in seriously. Building on the systems architecture we discussed in the chapter on quant trading systems and infrastructure, let's examine what a compliance infrastructure looks like. The key insight is that compliance in a quantitative firm is itself a data and systems problem. It requires ingesting real-time trading data, applying analytical logic to detect anomalies, generating reports, and maintaining audit trails, all of which demand the same engineering rigor as the trading systems themselves.
The Three Lines of Defense
Most financial firms organize risk and compliance around a "three lines of defense" model. This framework, originally developed by the Institute of Internal Auditors, provides a structured approach to managing risk by assigning distinct responsibilities to different organizational layers:
-
First line (trading desks and developers): The people building and running strategies are the first line of defense. They must understand the rules, implement controls in their code, and escalate concerns. You should understand the regulatory constraints relevant to your strategy. This means that compliance is not something you hand off to a separate team; it begins in the code you write and the design decisions you make.
-
Second line (compliance and risk management): Independent compliance officers and risk managers monitor trading activity, review new strategies before deployment, and advise on regulatory requirements. They operate independently from the revenue-generating functions. This independence is crucial, because it ensures that compliance judgments are not influenced by the pressure to generate returns. The second line serves as a check on the first, reviewing whether the controls implemented by developers are sufficient and whether trading activity conforms to regulatory expectations.
-
Third line (internal audit): Internal audit provides an independent assessment of whether the first two lines are functioning effectively. They test controls, review documentation, and report to the board or senior management. The third line operates at a level of remove that allows it to identify systemic weaknesses that might not be visible to those immersed in day-to-day operations.
Suspicious Activity Monitoring
Firms are required to monitor for and report suspicious trading activity. In the U.S., broker-dealers file Suspicious Activity Reports (SARs) with the Financial Crimes Enforcement Network (FinCEN). This monitoring must be systematic and ongoing, not ad hoc.
Let's implement a simple daily compliance report generator that summarizes key metrics a compliance officer would review. The report aggregates information about order activity, position utilization, profit-and-loss performance, and directional imbalances into a single summary that highlights areas requiring attention. This kind of daily summary serves as the starting point for compliance oversight: it does not replace detailed investigation, but it directs the compliance team's attention to the areas where investigation is most needed.
This report provides a snapshot that a compliance officer can review quickly. In practice, such reports would be generated continuously (not just daily), with real-time alerting for critical thresholds. The alerts triggered here, high cancel rate and approaching the loss limit, would prompt the compliance team to investigate further. A high cancel rate might be perfectly benign if it reflects a legitimate market-making strategy, but it also warrants verification that the cancellations are driven by genuine market dynamics rather than manipulative intent. The loss limit alert is more urgent, signaling that the firm's cumulative losses for the day are approaching the point at which automated trading should be curtailed or halted entirely.
Key Parameters
The key parameters for the compliance report represent the thresholds at which normal trading activity transitions into territory that warrants heightened scrutiny:
- max_cancel_rate: The maximum percentage of orders that can be cancelled before triggering an alert (e.g., 60% in our example, though in practice many firms set this higher, around 90%, for desks that legitimately engage in frequent quote updates). High cancellation rates can indicate spoofing or inefficient algorithms. The appropriate threshold depends heavily on the strategy type: a market-making desk will naturally have a higher cancel rate than an event-driven desk, so the threshold should be calibrated per strategy rather than applied uniformly across the firm.
- max_position_utilization: The threshold for position limit usage (e.g., 80%). Crossing this warns that the desk is nearing its hard cap. The purpose of setting the warning threshold below 100% is to give risk managers time to intervene before the hard limit is actually breached. A desk at 80% of its position limit still has room to trade, but the compliance team should begin monitoring the situation more closely.
- max_loss_utilization: The threshold for daily loss limit usage (e.g., 80%). Early warning allows risk managers to intervene before the hard stop is hit. This is critical because losses can accelerate: a desk that has lost 80% of its daily limit may be experiencing adverse market conditions that are likely to continue, and waiting until the full limit is consumed may be too late for an orderly risk reduction.
- max_otr_ratio: The maximum ratio of orders to executed trades (e.g., 20:1). High ratios attract regulatory scrutiny for potential quote stuffing. As with the cancel rate, this threshold should be calibrated to the strategy type, with higher thresholds permitted for strategies that naturally generate many order updates per trade.
Ethical Responsibilities of Quantitative Practitioners
Beyond legal compliance, you face ethical responsibilities that no regulation can fully capture. These responsibilities arise from the unique position you occupy: you possess technical skills that most market participants, regulators, and even their own managers may not fully understand. This knowledge asymmetry creates a special form of moral agency. When you are one of the few people who understand exactly how a system works and what its consequences might be, you bear a correspondingly greater responsibility for ensuring that those consequences are acceptable.
Transparency with Investors
If you manage money for external investors (as in a hedge fund), you have an obligation to clearly communicate:
- Strategy risks: Not just expected volatility, but tail risks, liquidity risks, and scenarios under which the strategy could suffer catastrophic losses. Recall from the chapter on risk management practices and policies that VaR alone does not capture tail risks. Investors deserve to understand the full risk profile, including scenarios that your model may assign low probability but that could nonetheless occur. The temptation to present only the favorable risk metrics, to show the Sharpe ratio and annual return without dwelling on the maximum drawdown or the conditional tail expectation, is a form of dishonesty by omission.
- Capacity constraints: Most quantitative strategies have limited capacity. The alpha from a statistical arbitrage strategy, as we discussed in Part VI, decays as assets under management grow. This decay occurs because larger positions generate greater market impact, narrowing the very price dislocations the strategy seeks to exploit. Accepting more capital than a strategy can deploy effectively is an ethical failing, even if it increases management fees. It dilutes returns for existing investors and may ultimately destroy the strategy's viability for everyone.
- Model limitations: Every model makes assumptions. Communicating those assumptions honestly, rather than presenting a model's outputs with false precision, is essential. As we saw throughout the calibration chapter, models are approximations: useful but inherently limited. The confidence intervals around your return forecasts are wide, the distributions you assume may not hold during stress events, and the historical data on which your model was trained may not be representative of future conditions. Honest communication of these limitations builds trust and enables investors to make informed allocation decisions.
The Responsibility of Knowledge Asymmetry
When you design an algorithm that interacts with millions of market participants, many of whom lack your technical sophistication, you bear a responsibility not to exploit that knowledge asymmetry in ways that harm others. This goes beyond what regulators explicitly prohibit. It is a matter of professional ethics, of what kind of practitioner you choose to be.
For example, designing a market-making algorithm that systematically widens spreads for less sophisticated counterparties (sometimes called "adverse selection targeting") may not be illegal, but it raises ethical questions about fairness. If your algorithm can identify, through the timing, sizing, or routing characteristics of incoming orders, that a counterparty is likely a retail investor rather than an informed institutional trader, and it systematically offers worse prices to that retail investor, you are using your technological advantage to extract value from those least able to protect themselves. Similarly, building systems that exploit behavioral biases in retail traders, while potentially profitable, conflicts with the market's function as a fair arena for price discovery.
Systemic Impact
Individual trading strategies, when aggregated, can affect market stability. The proliferation of similar factor strategies can lead to crowded trades and coordinated unwinds, as occurred in the August 2007 quant crisis. As we discussed in the chapter on factor investing and long/short equity, when many quant firms hold similar positions, the forced deleveraging of one firm can cascade through the entire quant ecosystem. The mechanism is straightforward: if many firms hold the same long-short portfolio and one firm is forced to liquidate due to margin calls, the resulting selling pressure depresses the prices of the long positions and elevates the prices of the short positions, causing mark-to-market losses for every other firm with a similar portfolio. Those losses can trigger further margin calls, further liquidations, and a vicious cycle.
You have a responsibility to consider: if every firm deployed my strategy, what would the systemic consequences be? If the answer is "market instability," that should give you pause, not because regulators require it, but because the stability of the financial system ultimately determines whether your strategies have a market to operate in. The paradox of quantitative finance is that strategies which are individually rational can be collectively destructive. Recognizing this paradox, and incorporating it into your strategy design, is a hallmark of ethical practice.
A Framework for Ethical Decision-Making
Let's synthesize the topics covered in this chapter into a practical decision framework that you can apply when designing and deploying quantitative strategies. The framework is organized as a hierarchy of five layers, each representing a progressively higher standard of conduct. The narrowest and most fundamental layer is legal compliance: simply obeying the law. Each successive layer broadens the scope of concern, from the letter of the law to its spirit, from the interests of your firm to the interests of your clients, from the fairness of your specific interactions to the integrity of the market as a whole, and finally to the stability of the entire financial system.
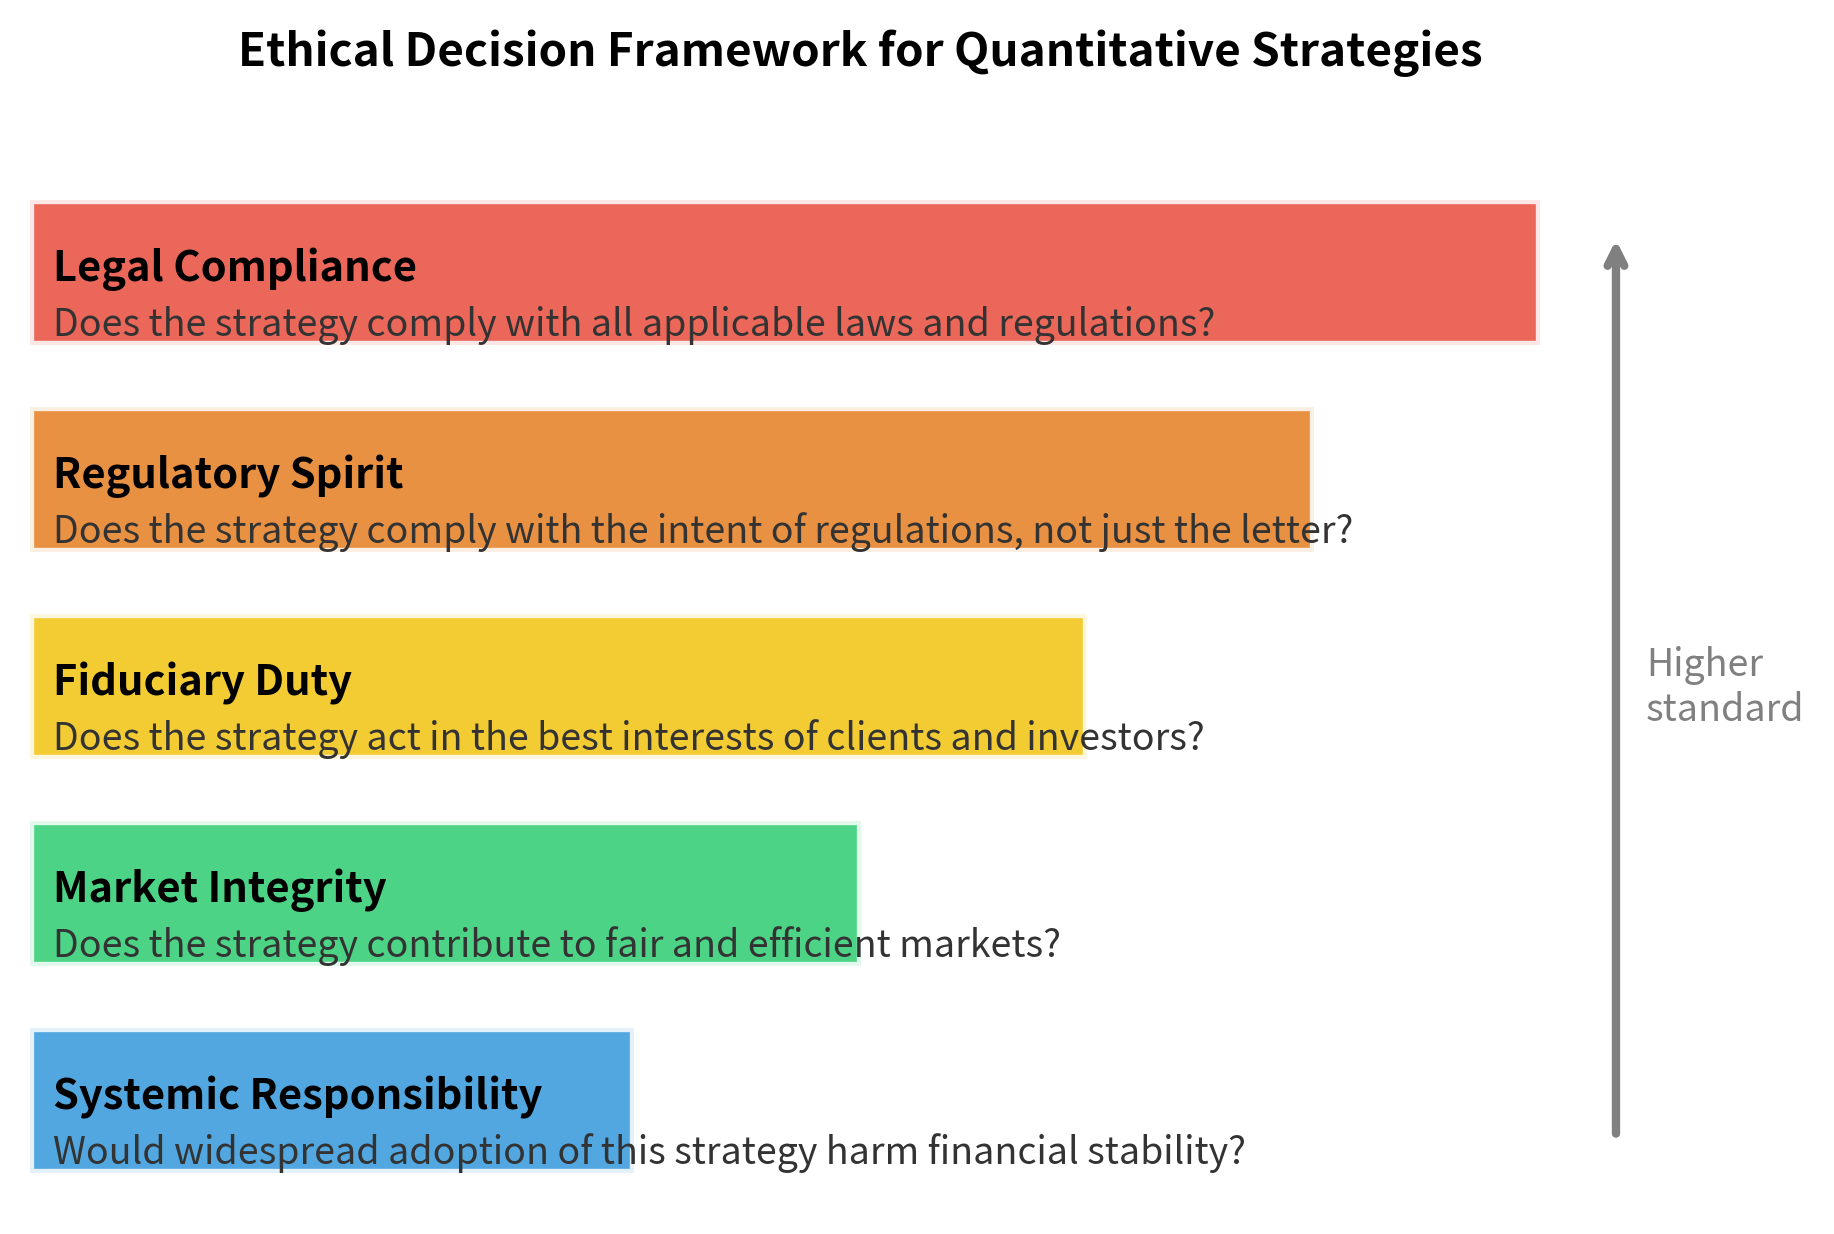
When evaluating a strategy, work through these layers from the bottom up. Legal compliance is the minimum bar: strategies that violate securities law will eventually result in fines, criminal charges, or firm closure. But aspiring to higher layers, considering fiduciary duty, market integrity, and systemic responsibility, distinguishes the best quantitative practitioners from those who merely avoid prosecution. A strategy may be perfectly legal and yet fall short on fiduciary grounds if it exposes clients to risks they have not been adequately informed about. A strategy may satisfy fiduciary duties and yet undermine market integrity if it systematically exploits structural advantages in ways that degrade the quality of the market for other participants. And a strategy may contribute positively to market integrity in normal times and yet pose systemic risks if widely adopted. Working through all five layers provides a comprehensive evaluation that no single legal or ethical test can capture alone.
Limitations and Practical Implications
The regulatory landscape presents several fundamental challenges for quantitative practitioners. First, regulations lag technology. By the time regulators develop rules for a new trading technique, the technique may have already evolved or been superseded. This gap means that legal compliance alone is insufficient: you must exercise judgment about practices that regulations have not yet addressed. The rapid growth of cryptocurrency markets, decentralized finance, and AI-driven trading strategies all exist in regulatory grey zones where the rules are still being written.
Second, regulatory fragmentation creates arbitrage opportunities that can be ethically problematic. A strategy that is prohibited in the EU under MAR may be permissible in a less regulated jurisdiction. The temptation to exploit regulatory differences by routing activity through the most permissive venue is real, but firms that do so often find themselves subject to enforcement action when regulators cooperate across borders, as they increasingly do through organizations like IOSCO and the Financial Stability Board.
Third, compliance technology is an ongoing investment, not a one-time cost. The monitoring tools we built in this chapter are simplified illustrations. Production compliance systems require continuous updating as regulations change, new instruments are traded, and algorithms evolve. Many firms underinvest in compliance infrastructure because it does not directly generate revenue, but the asymmetric risk profile, where a single compliance failure can destroy a firm, makes it one of the highest-return investments a quantitative firm can make.
Finally, there is a human judgment problem that no algorithm can fully solve. Determining whether a pattern of order cancellations constitutes spoofing or legitimate market making requires understanding intent, which is inherently subjective. Deciding whether an alternative data source crosses the line from clever to unethical requires weighing competing values. Training compliance staff, maintaining a culture of ethical awareness, and creating an environment where people feel comfortable raising concerns are all essential, and none of them can be reduced to code.
Summary
This chapter addressed the ethical and regulatory dimensions that you must navigate. The key takeaways are:
-
Market manipulation includes spoofing, layering, front-running, insider trading, and wash trading. Understanding these prohibited practices is essential not only to avoid engaging in them but to ensure your algorithms do not inadvertently produce manipulative patterns.
-
Regulatory frameworks vary by jurisdiction but share common goals of market integrity, investor protection, and systemic stability. Key regulations include Reg NMS, the Dodd-Frank Act, and MiFID II, each imposing specific requirements on algorithmic trading.
-
Algorithmic safeguards including kill switches, pre-trade risk controls, price collars, and position limits are both regulatory requirements and operational necessities. Every order your algorithm submits should pass through a chain of risk checks.
-
Compliance is an engineering challenge as much as a legal one. Monitoring order-to-trade ratios, cancel rates, and cross-market patterns requires sophisticated systems that operate in real time alongside your trading algorithms.
-
High-frequency trading raises legitimate fairness and stability concerns that continue to drive regulatory evolution. Understanding both sides of the HFT debate helps you anticipate regulatory changes that could affect your strategies.
-
Data ethics goes beyond legal compliance. The provenance, consent, and privacy implications of alternative data require careful evaluation, especially as new data sources proliferate.
-
Ethical responsibility extends beyond rules. You bear responsibility for the systemic impact of your strategies, the transparency of your communications with investors, and the fairness of your interactions with less sophisticated market participants.
In the next chapter, we will bring together everything you have learned throughout this book in a comprehensive case study: building a quantitative strategy from scratch, from research hypothesis through implementation, risk management, and, yes, regulatory compliance.
Quiz
Ready to test your understanding? Take this quick quiz to reinforce what you've learned about ethical trading practices, regulatory frameworks, and compliance infrastructure.

Comments